

Question: Please I need help on this. I've seen a few other posts on this same question, but none of those have actually produced an answer.
Please I need help on this. I've seen a few other posts on this same question, but none of those have actually produced an answer. Please this is due on Wednesday, and I have already been trying for 3 days now.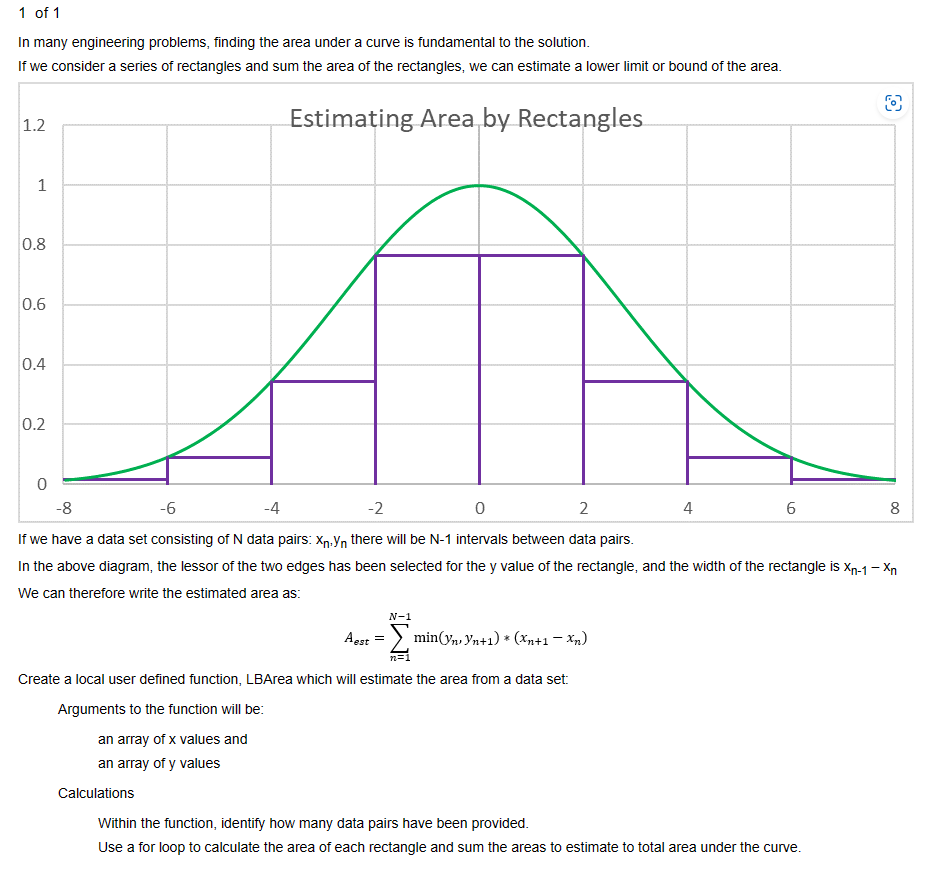
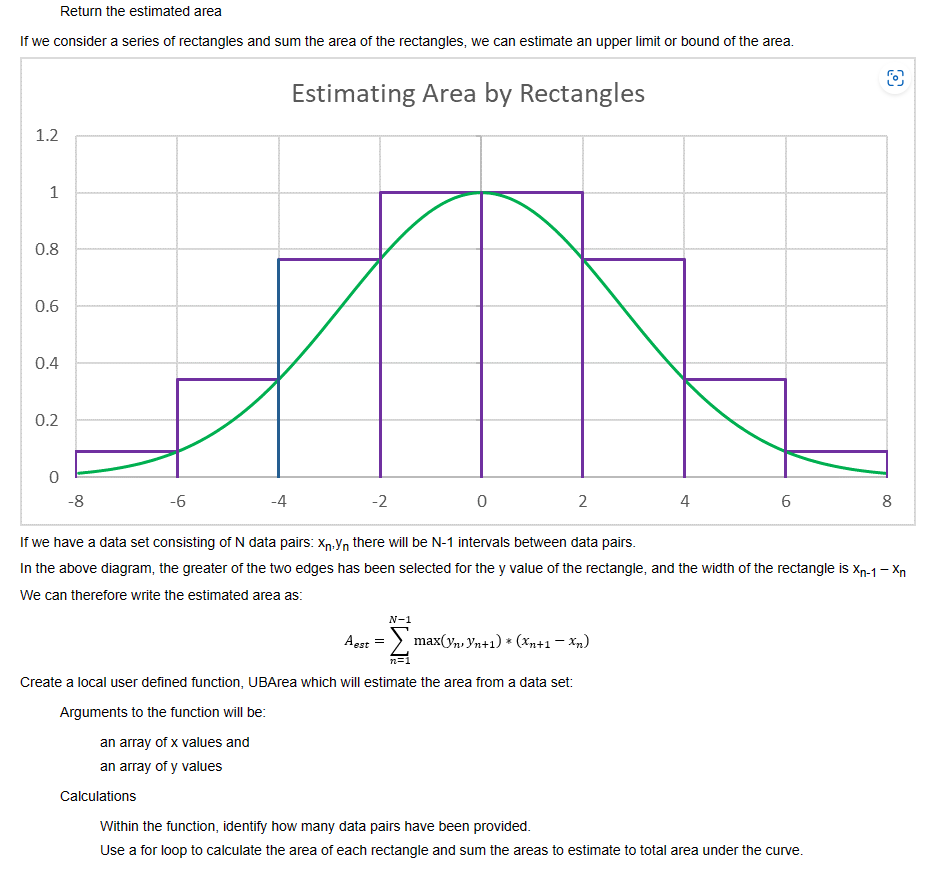
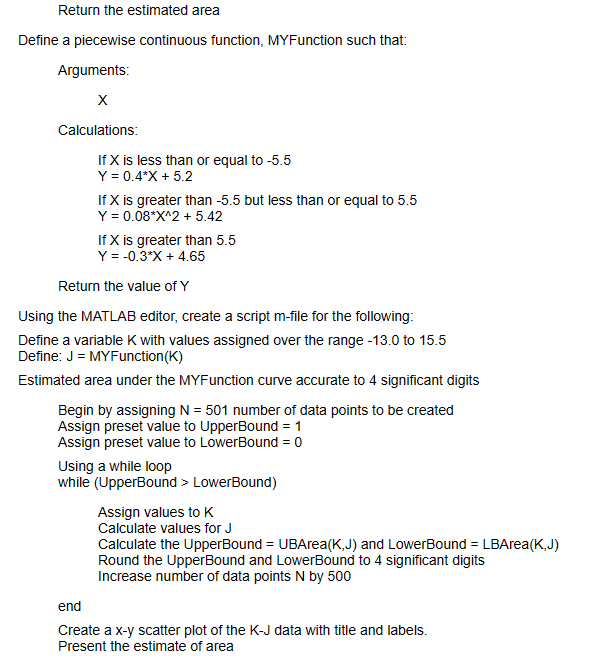
In many engineering problems, finding the area under a curve is fundamental to the solution. If we consider a series of rectangles and sum the area of the rectangles, we can estimate a lower limit or bound of the area. In the above diagram, the lessor of the two edges has been selected for the y value of the rectangle, and the width of the rectangle is xn1xn We can therefore write the estimated area as: Aest=n=1N1min(yn,yn+1)(xn+1xn) Create a local user defined function, LBArea which will estimate the area from a data set: Arguments to the function will be: an array of x values and an array of y values Calculations Within the function, identify how many data pairs have been provided. Use a for loop to calculate the area of each rectangle and sum the areas to estimate to total area under the curve. Return the estimated area If we consider a series of rectangles and sum the area of the rectangles, we can estimate an upper limit or bound of the area. In the above diagram, the greater of the two edges has been selected for the y value of the rectangle, and the width of the rectangle is xn1xn We can therefore write the estimated area as: Aest=n=1N1max(yn,yn+1)(xn+1xn) Create a local user defined function, UBArea which will estimate the area from a data set: Arguments to the function will be: an array of x values and an array of y values Calculations Within the function, identify how many data pairs have been provided. Use a for loop to calculate the area of each rectangle and sum the areas to estimate to total area under the curve. Return the estimated area Define a piecewise continuous function, MYFunction such that: Arguments: X Calculations: If X is less than or equal to -5.5 Y=0.4X+5.2 If X is greater than -5.5 but less than or equal to 5.5 Y=0.08X2+5.42 If X is greater than 5.5 Y=0.3X+4.65 Return the value of Y Using the MATLAB editor, create a script m-file for the following: Define a variable K with values assigned over the range -13.0 to 15.5 Define: J= MYFunction (K) Estimated area under the MYFunction curve accurate to 4 significant digits Begin by assigning N=501 number of data points to be created Assign preset value to UpperBound =1 Assign preset value to LowerBound =0 Using a while loop while (UpperBound > LowerBound) Assign values to K Calculate values for J Calculate the UpperBound = UBArea (K,J) and LowerBound = LBArea (K,J) Round the UpperBound and LowerBound to 4 significant digits Increase number of data points N by 500 end Create a x-y scatter plot of the K-J data with title and labels. Present the estimate of area
Step by Step Solution
There are 3 Steps involved in it

Get step-by-step solutions from verified subject matter experts