

Question: please I need help solving this practice question Q2.(10) A survey about the number of new students in each college in Ontario was done. The
please I need help solving this practice question
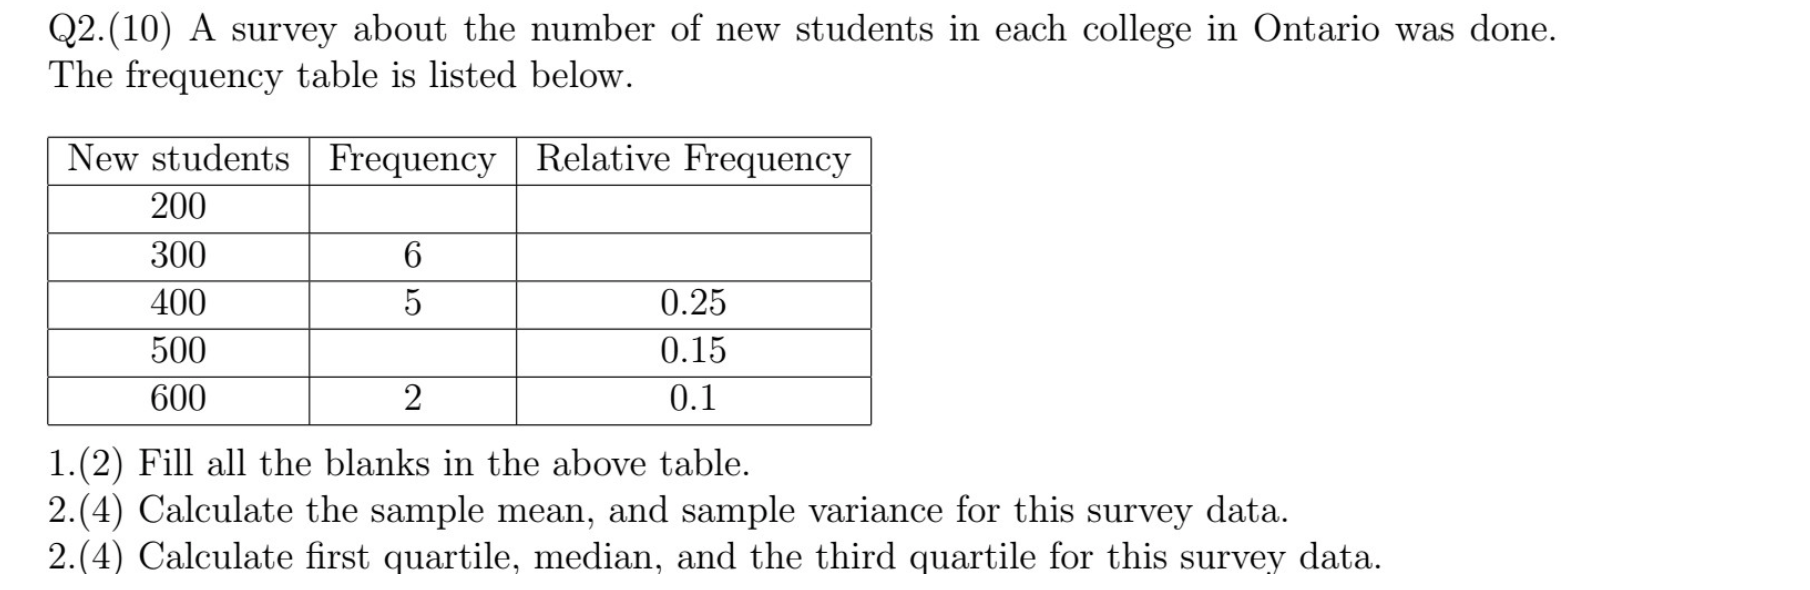
Q2.(10) A survey about the number of new students in each college in Ontario was done. The frequency table is listed below. New students Frequency Relative Frequency 200 300 400 0.25 500 0.15 600 0.1 1.(2) Fill all the blanks in the above table. 2.(4) Calculate the sample mean, and sample variance for this survey data. 2(4) Calculate rst quartile, median, and the third quartile for this survey data
Step by Step Solution
There are 3 Steps involved in it
1 Expert Approved Answer
Step: 1 Unlock

Question Has Been Solved by an Expert!
Get step-by-step solutions from verified subject matter experts
Step: 2 Unlock
Step: 3 Unlock