

Question: please i need help with this assignment:: Note: This template provides aameworhfor your report. The text in italics provides guidance about what to include in

please i need help with this assignment::
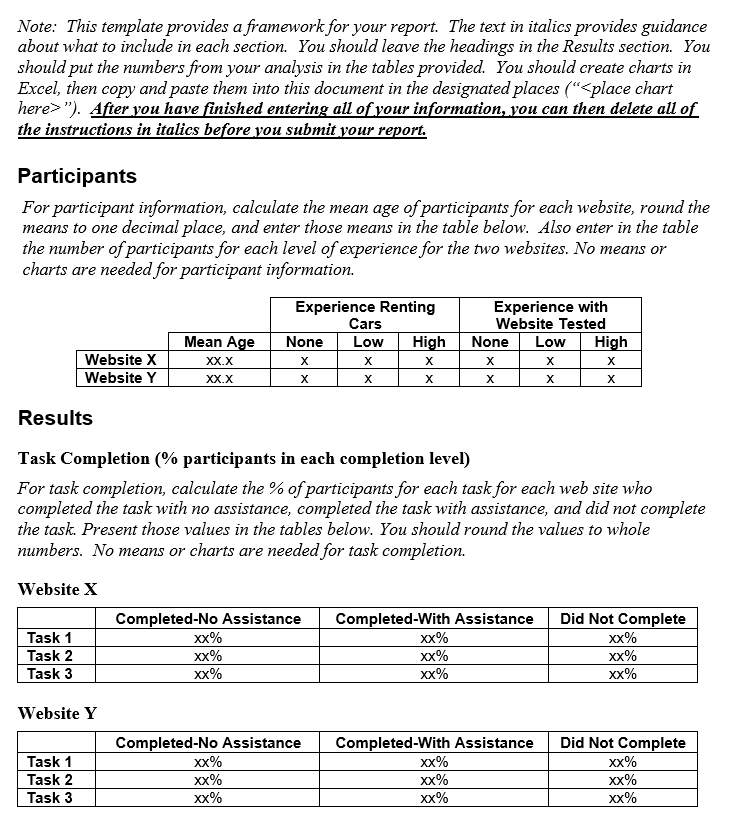

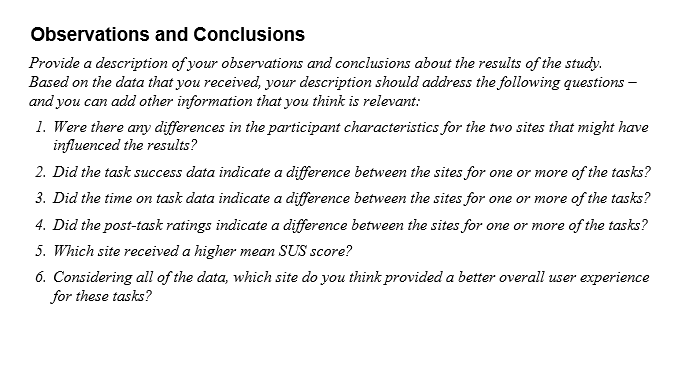
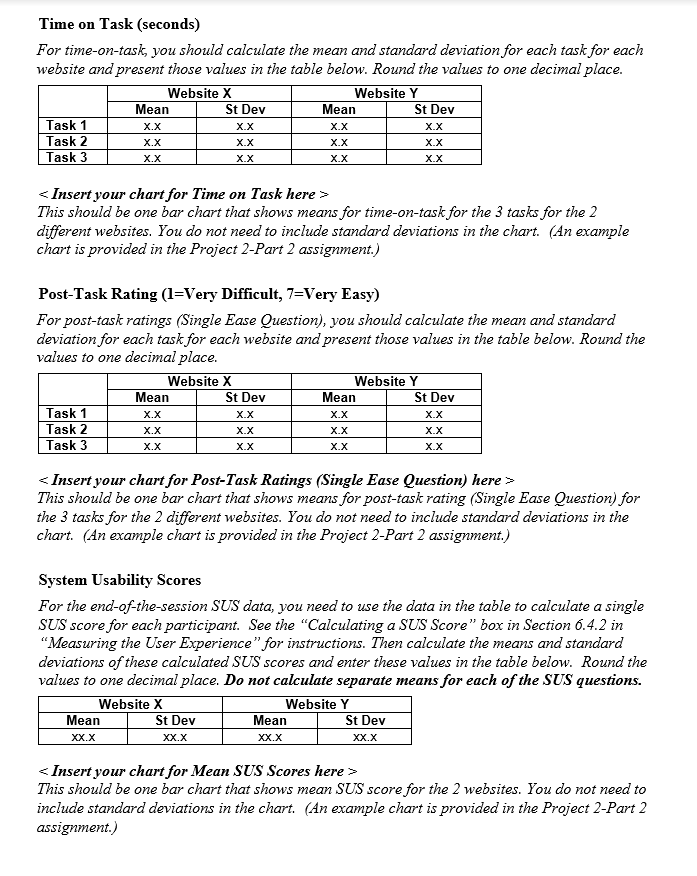
Note: This template provides aameworhfor your report. The text in italics provides guidance about what to include in each section. You should leave the headings in the Results section. You should put the numbers om your analysis in the tables provided. You should create charts in Excel, then cop}.J and paste them into this document in the designated places (\"siplace chart here} '3]. Aer mu have finished entering all of your information, [on can then delete all of the instructions in italics betas-e mu submit your rgort. Participants For participant information, calculate the mean age of participants for each website, round the means to one decimal place, and enter those means in the table below. Also enter in the table the number of participants for each level of experience for the two websites. No means or charts are needed for participant innrmation Experience Renting Cars Experience with Website Tested Items\"nun\":- \"Ii-nun\":- Res ults Task Completion (% participants in each completion level) For task completion, calculate the \"/6 of participants for each taslcfor each web site who completed the tasl: with no assistance, completed the task with assistance, and did not complete the task. Present those values in the tables below. You should round the values to whole numbers. No means or charts are needed for tasl: completion. Website X Completed-No Assistance Completed-With Assistance Did Not Complete \fObservations and Conclusions Provide a description ofyour observations and conciusioru; about the results of the study. Based on the data that you received, your description should address the following questions and you can add other inrmation that you think is relevant: I. Were there any diferences in the patiapant characteristics for the two sites that might have inuenced the resufts? 2. Did the task success data indicate a difference between the sites for one or more of the tasks? 3. Did the time on test: data indicate a difference between the sites Jr one or more of the tasks? 4. Did the posttask ratings indicate a di'erence between the sites for one or more of the tasks? 5. Which site received a higher mean SUS score? 6. Considering all of the data, which site do you think provided a better overall user experience for these tasks
Step by Step Solution
There are 3 Steps involved in it

Get step-by-step solutions from verified subject matter experts