

Question: please i need it today thank you compose a 250-500 word document focusing on Amazon statement of financial position. Include in the response. Make sure
- The company name ( Amazon)
- The annual financial report year(s).
- A summary of your horizontal, vertical, and ratio analysis and what it tells you as a potential investor.
- Tour option about the overall performance of the chosen
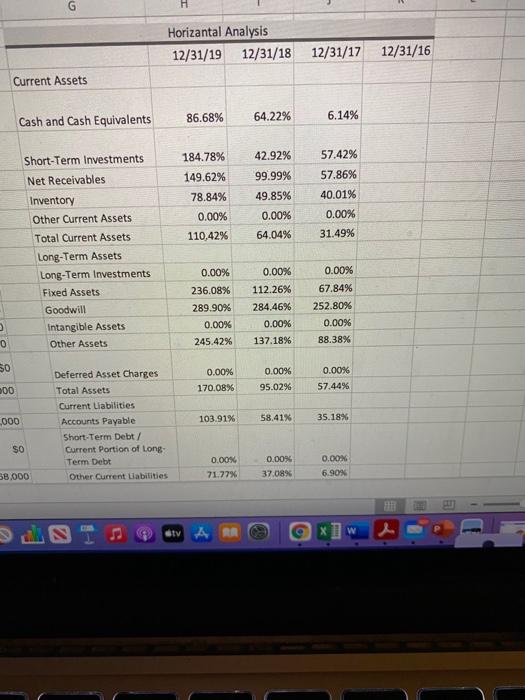
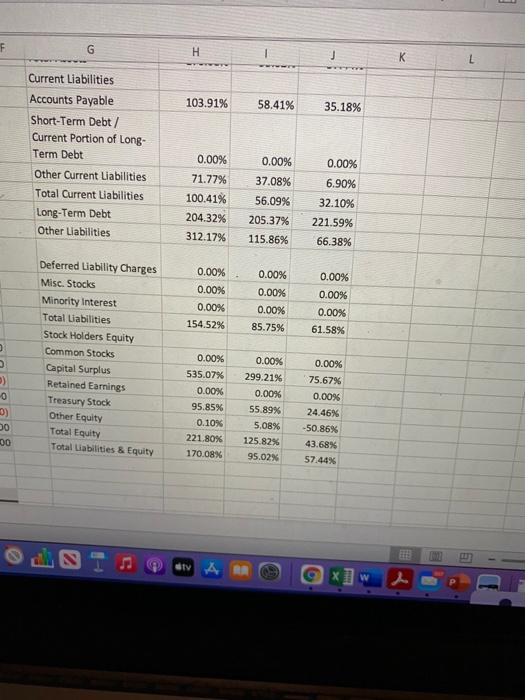
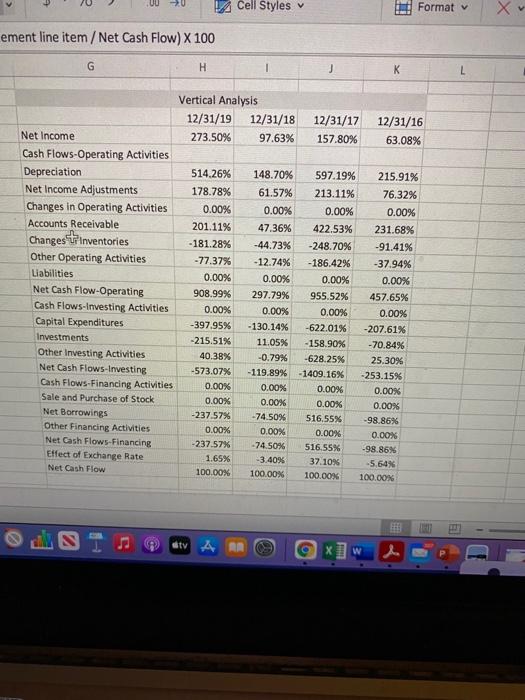
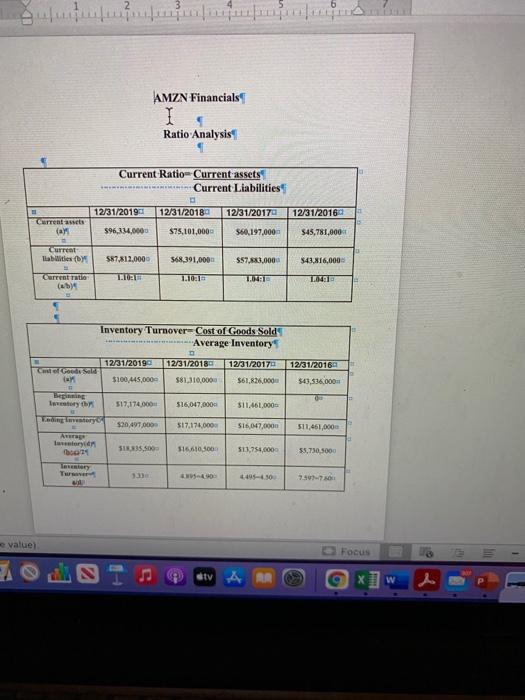
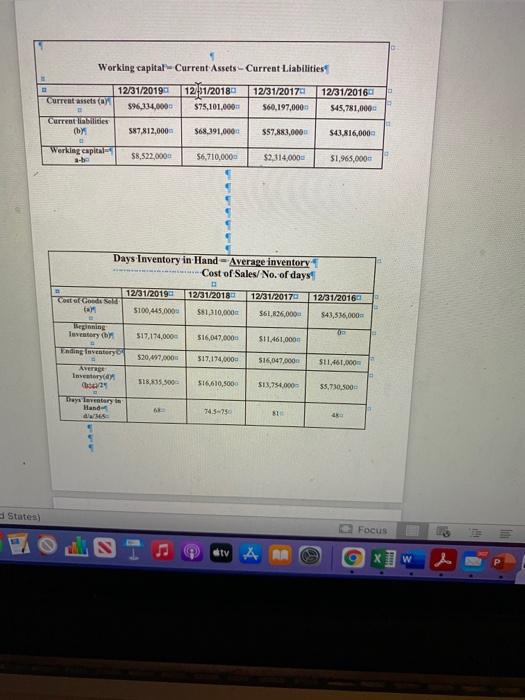
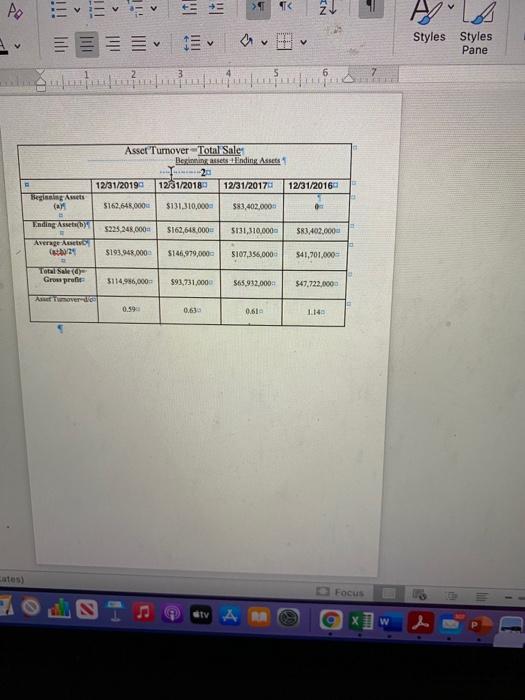
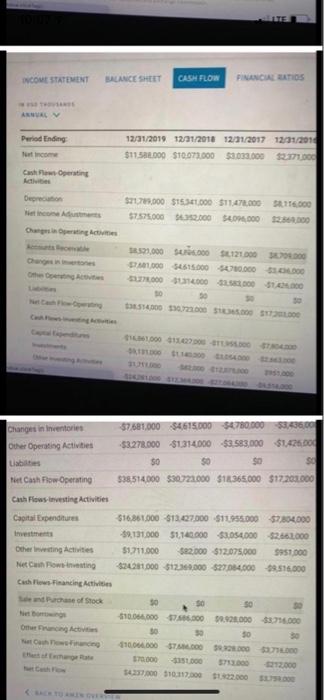
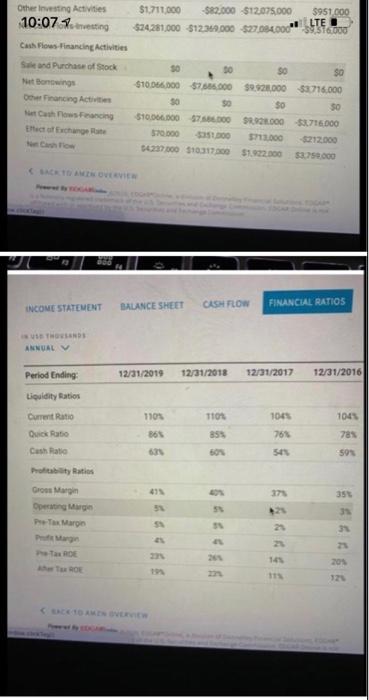
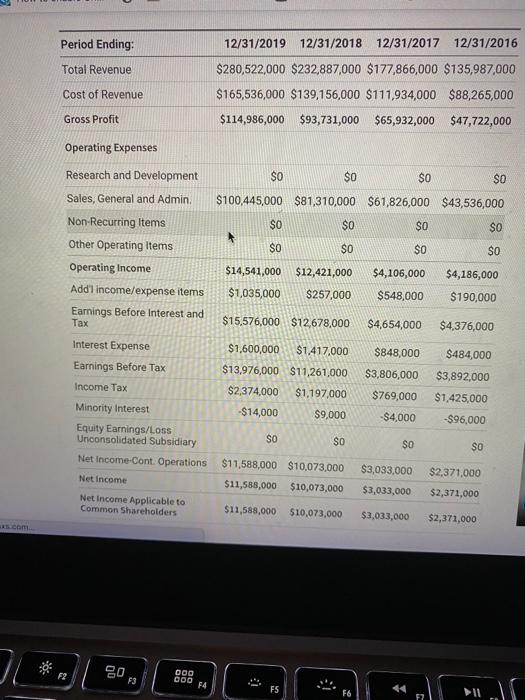
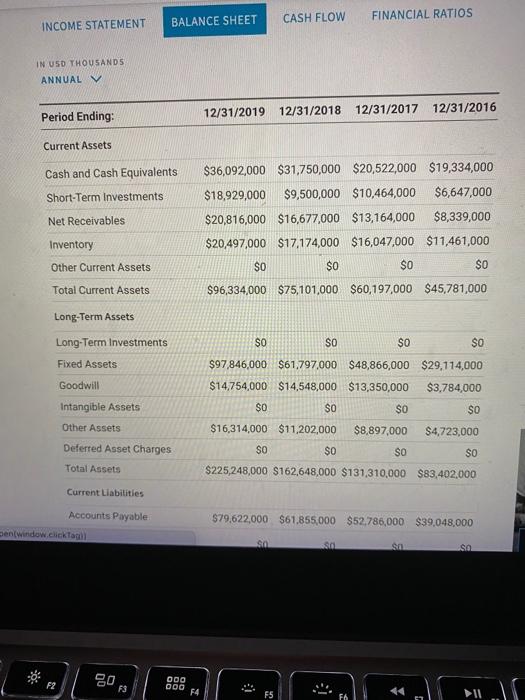
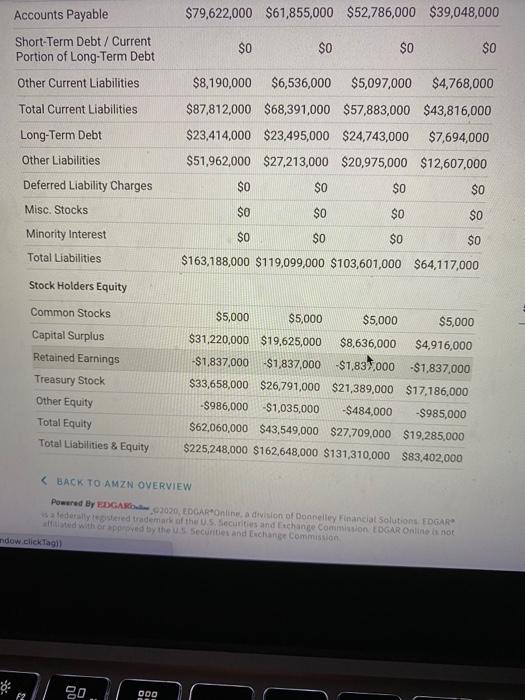
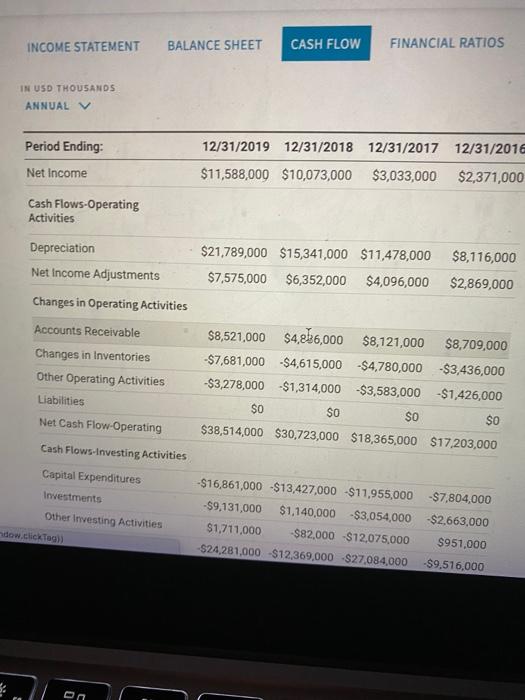
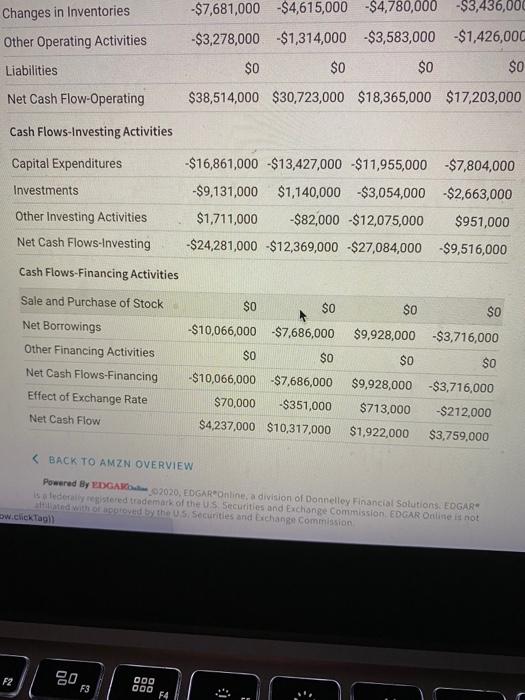
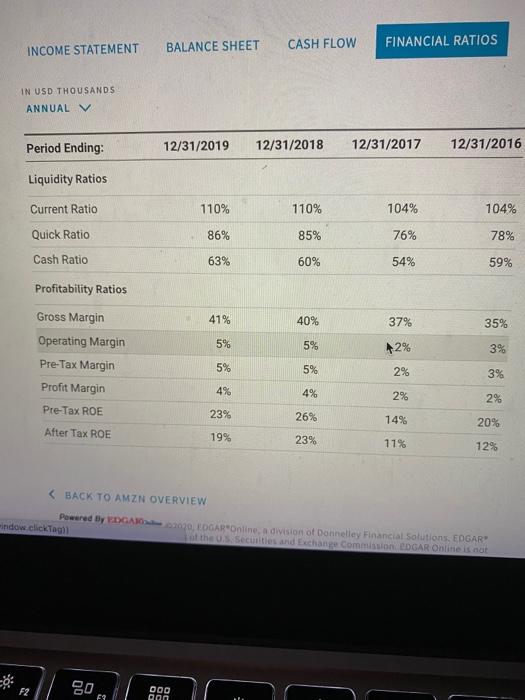

G Horizantal Analysis 12/31/19 12/31/18 12/31/17 12/31/16 Current Assets 86.68% Cash and Cash Equivalents 64.22% 6.14% 42.92% 184.78% 149.62% 78.84% 0.00% 57.42% 57.86% 40.01% 99.99% 49.85% 0.00% 64.04% 0.00% 110,42% 31.49% Short-Term Investments Net Receivables Inventory Other Current Assets Total Current Assets Long-Term Assets Long-Term Investments Fixed Assets Goodwill Intangible Assets Other Assets 0.00% 236.08% 289.90% 0.00% 245,42% 0.00% 112.26% 284.46% 0.00% 137.18% 0.00% 67.84% 252.80% 0.00% 88.38% 0 SO 0.00% 170.08% 0.00% 95.02% 0.00% 57.44% 000 2000 103.91% 58,41% 35.18% Deferred Asset Charges Total Assets Current Liabilities Accounts Payable Short-Term Debt/ Current Portion of Long. Term Debt Other Current Liabilities $0 0.00% 71.77% 0.00% 37.08% 0.00% 6.90% 58.000 SIV X w F G H 103.91% 58.41% 35.18% Current Liabilities Accounts Payable Short-Term Debt / Current Portion of Long- Term Debt Other Current Liabilities Total Current Liabilities Long-Term Debt Other Llabilities 0.00% 0.00% 0.00% 37.08% 6.90% 71.77% 100.41% 204.32% 312.1796 56.09% 205.37% 115.86% 32.10% 221.59% 66.38% 0.00% 0.00% 0.00% 154.52% 0.00% 0.00% 0.00% 85.75% 0.00% 0.00% 0.00% 61.58% Deferred Liability Charges Misc. Stocks Minority Interest Total Uabilities Stock Holders Equity Common Stocks Capital Surplus Retained Earnings Treasury Stock Other Equity Total Equity Total Liabilities & Equity 2) 0 03 30 00 0.00% 535.07% 0.00% 95.85% 0.10% 221.80% 170.08% 0.00% 299.21% 0.00% 55.89% 5,08% 125.82% 95.02% 0.00% 75.67% 0.0096 24.46% -50.86% 43.68% 57.44% ty w UU 20 Cell Styles Format ement line item / Net Cash Flow) X 100 G H K 12/31/17 157.80% 12/31/16 63.08% 215.91% 76.32% 0.00% 231.68% Vertical Analysis 12/31/19 12/31/18 Net Income 273.50% 97.63% Cash Flows-Operating Activities Depreciation 514.26% 148.70% Net Income Adjustments 178.78% 61.57% Changes in Operating Activities 0.00% 0.00% Accounts Receivable 201.11% 47.36% Changes inventories -181.28% -44.73% Other Operating Activities -77.37% -12.74% Liabilities 0.00% 0.00% Net Cash Flow-Operating 908.99% 297.79% Cash Flows-Investing Activities 0.00% 0.00% Capital Expenditures -397.95% - 130.14% Investments -215.51% 11.05% Other Investing Activities 40.38% -0.79% Net Cash Flows-Investing -573.07% - 119.89% Cash Flows-Financing Activities 0.00% 0.00% Sale and Purchase of Stock 0.00% 0.00% Net Borrowings -237.57% -74.50% Other Financing Activities 0.00% 0.00% Net Cash Flows-Financing -237.57% -74.50% Effect of Exchange Rate 1.65% -3.40% Net Cash Flow 100.00% 100.00% 597.19% 213.11% 0.00% 422.53% -248.70% -186.42% 0.00% 955.52% 0.00% -622.01% -158.90% -628.25% -1409.16% 0.00% 0.00% 516.55% 0.00% 516.55% 37.10% 100.00% -91.41% -37.94% 0.00% 457.65% 0.00% -207.61% -70.84% 25.3096 -253.159 0.00% 0.00% -98.86% 0.00% -98.86% -5.64% 100.00% atv ARA w AMZN Financials I Ratio Analysis Current Ratio Current assets Current Liabilities 12/31/2019 12/31/2018 12/31/2017 12/31/2016 Current acts (art 596,314,0000 $75,101,000 560,197,000 545,781,000 Curret Tables 587.812,000 568.391,000 $57.3.0000 $43,816,000 Current ratio TTO 1.10 102 Inventory Turnover Cost of Goods Sold Average Inventory 12/31/2019 12/31/2018 12/31/2017 12/31/2016 CGS CY $100,445,000 581.310.000 $61.826,000 543,536,000 Being 517,174,000 516,047,000 $11.461.000 $20,497.000 517.174,000 516,047.0000 511,461,000 Aug aren 51835,500 316.616.00 513,754,000 55,750,000 7.5977 value D Focus Stv RA X w Working capital - Current Assets Current Liabilities 3 Current assets 12/31/20190 $96.334,0000 12/31/2018 $75,101,0000 12/31/2017 560,197,0000 12/31/2016 545,781,000 Current liabilities 587,812,000 $68.391.000 557.883.000 S43.816,0000 Werking capital $8,522,0000 56,710,0000 $2,314,000 $1,965,000 Days Inventory in Hand - Average inventory Cost of Sales/No. of days 12/31/2019 12/31/2018 COGS 5100,445.000 S810 10,000 12/31/2017 12/31/2016 561,625,000 $43,525.0000 Beginning Lavatory 517,174.000 516,047.000 $11.461,000 nding inventory $20,477.000 517,174,000 516,047.0000 $11.461.000 Avere Inventory : ** 518.855.300 516610,5000 $13.754.000 55,730,500 y lerenture Hand 745-79 SI States) O Focus atv RA 9 x W d to 111 + +
Step by Step Solution
There are 3 Steps involved in it

Get step-by-step solutions from verified subject matter experts