

Question: Please i need step by step please with the formula.. I ha e provided examples for this hw that the professor sent us..I donot know
 Please i need step by step please with the formula..
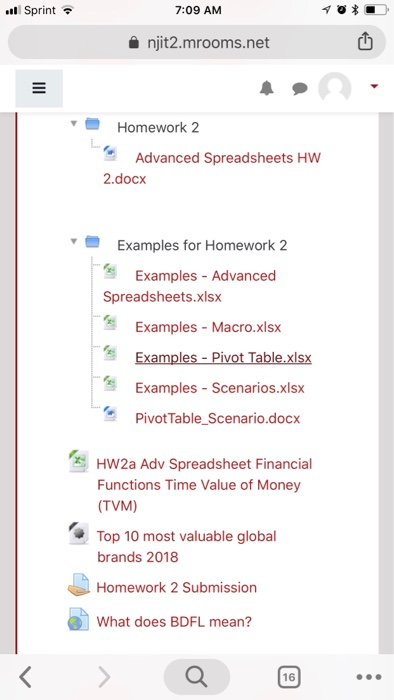
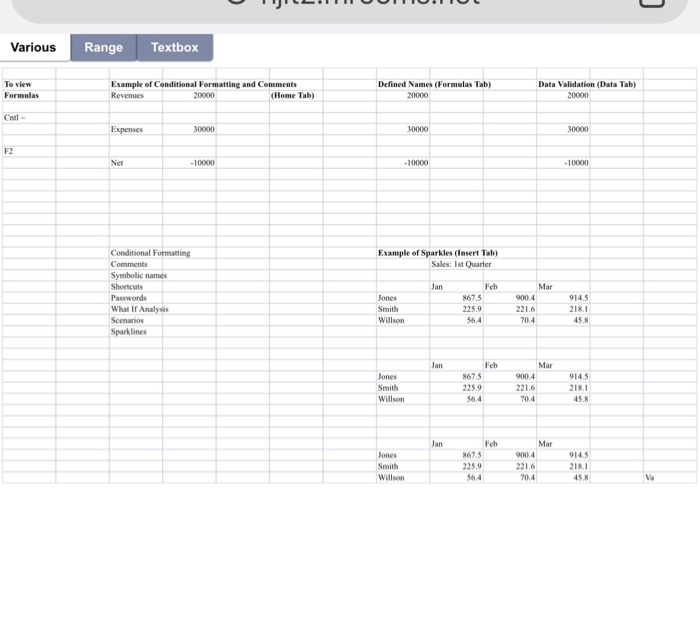
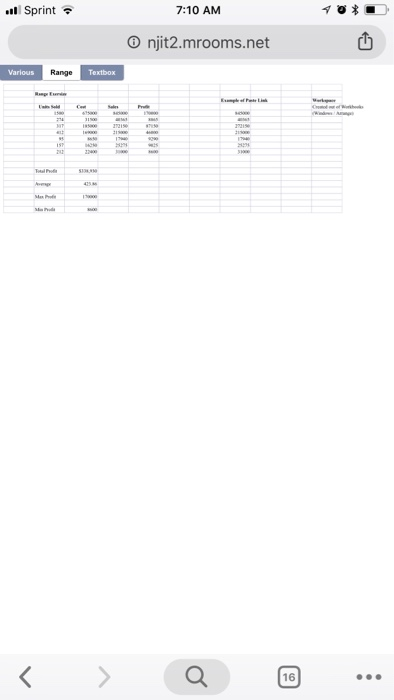

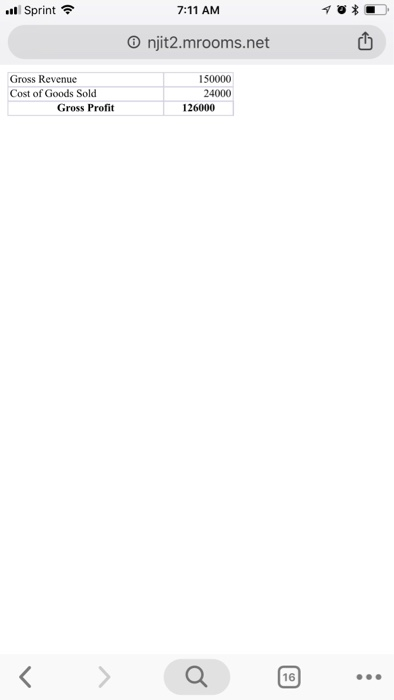
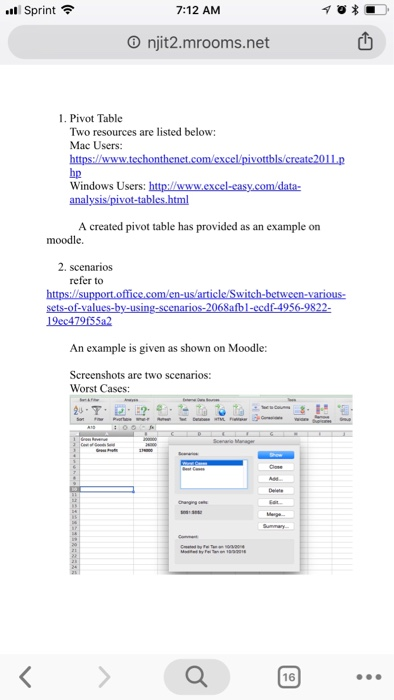
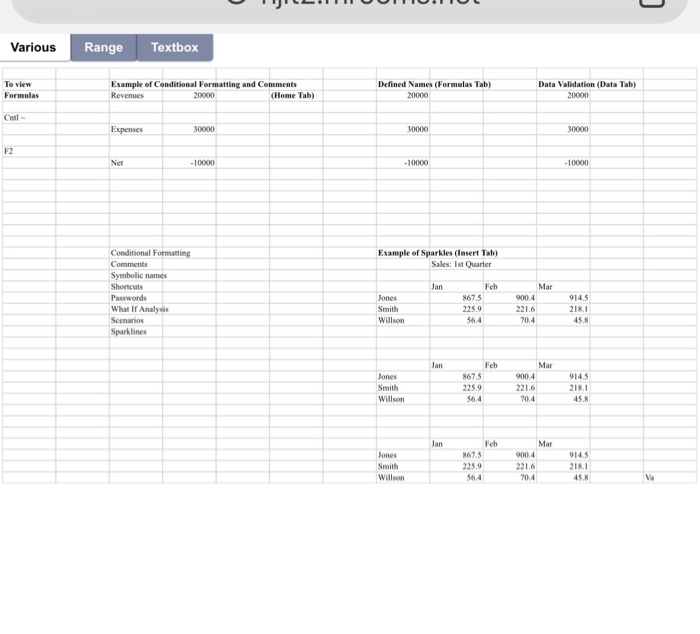
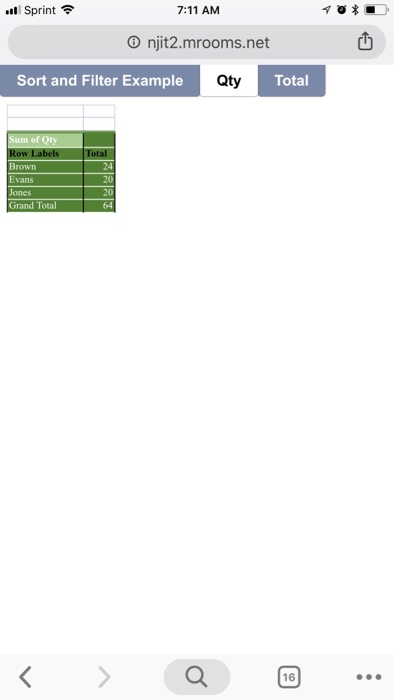
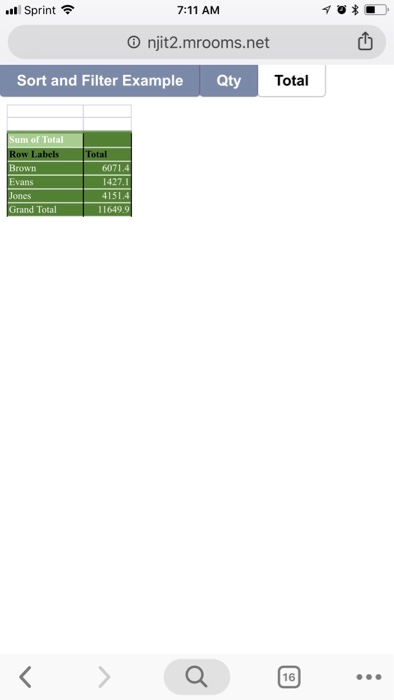
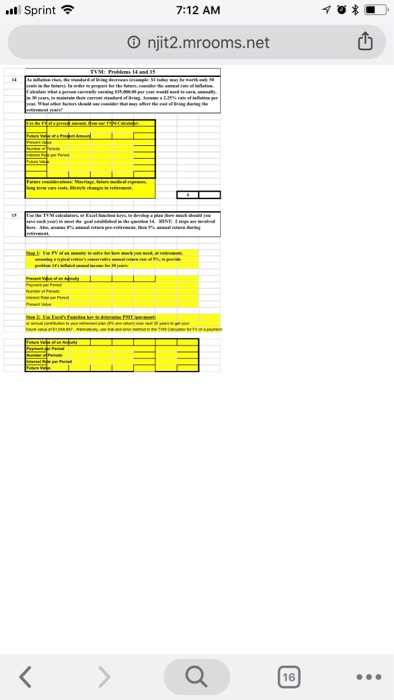
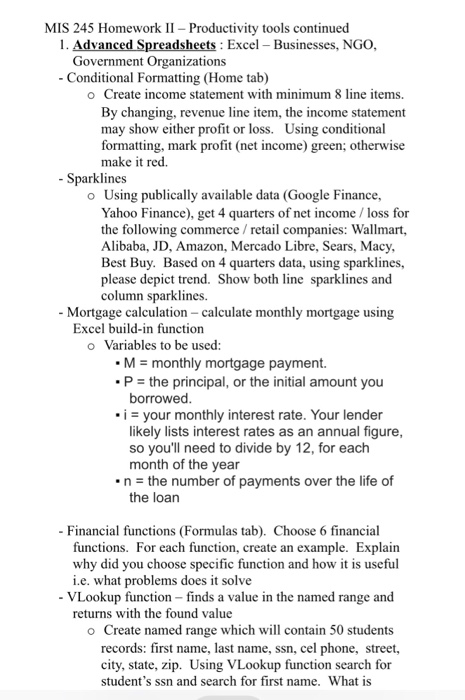
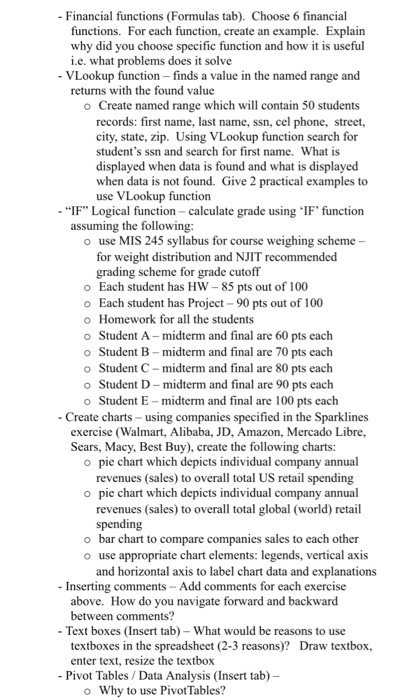
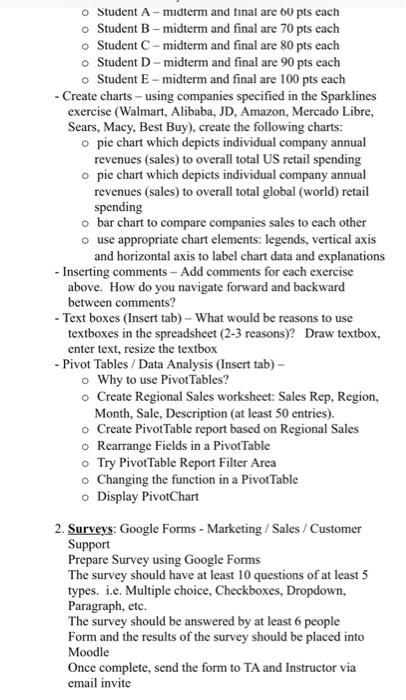
MIS 245 Homework II Productivity tools continued . Advanced Spreadsheets: Excel Businesses, NGO Government Organizations Conditional Formatting (Home tab) o Create income statement with minimum 8 line items. By changing, revenue line item, the income statement may show either profit or loss. Using conditional formatting, mark profit (net income) green; otherwise make it red. -Sparklines o Using publically available data (Google Finance, Yahoo Finance), get 4 quarters of net income / loss for the following commerce retail companies: Wallmart, Alibaba, JD, Amazon, Mercado Libre, Sears, Macy Best Buy. Based on 4 quarters data, using sparklines, please depict trend. Show both line sparklines and column sparklines. - Mortgage calculation- calculate monthly mortgage using Excel build-in function o Variables to be used: M monthly mortgage payment. P the principal, or the initial amount you borrowed iyour monthly interest rate. Your lender likely lists interest rates as an annual figure so you'll need to divide by 12, for each month of the year n the number of payments over the life of the loan Financial functions (Formulas tab). Choose 6 financial functions. For each function, create an example. Explain why did you choose specific function and how it is useful - VLookup function-finds a value in the named range and o Create named range which will contain 50 students city, state, zip. Using VLookup function search for i.e. what problems does it solve returns with the found value records: first name, last name, ssn, cel phone, street, student's ssn and search for first name. What is Financial functions (Formulas tab). Choose 6 financial functions. For each function, create an example. Explain i.e. what problems does it solve returns with the found value why did you choose specific function and how it is useful - VLookup function finds a value in the named range and o Create named range which will contain 50 students records: first name, last name, ssn, cel phone, street, city, state, zip. Using VLookup function search for student's ssn and search for first name. What is displayed when data is found and what is displayed when data is not found. Give 2 practical examples to use VLookup function -"IF" Logical function-calculate grade using 'IF' function assuming the following: o use MIS 245 syllabus for course weighing scheme - for weight distribution and NJIT recommended grading scheme for grade cutoff o Each student has HW 85 pts out of 100 o Each student has Project-90 pts out of 100 o Homework for all the students o Student A-midterm and final are 60 pts each o Student B midterm and final are 70 pts each o Student C-midterm and final are 80 pts each o Student D midterm and final are 90 pts each o Student E midterm and final are 100 pts each Create charts- using companies specified in the Sparklines exercise (Walmart, Alibaba, JD, Amazon, Mercado Libre, Sears, Macy, Best Buy), create the following charts: o pie chart which depicts individual company annual revenues (sales) to overall total US retail spending o pie chart which depicts individual company annual revenues (sales) to overall total global (world) retail o bar chart t o compare companies sales to each other o use appropriate chart elements: legends, vertical axis and horizontal axis to label chart data and explanations - Inserting comments- Add comments for each exercise above. How do you navigate forward and backward between comments? -Text boxes (Insert tab)-What would be reasons to use textboxes in the spreadsheet (2-3 reasons)? enter text, resize the textbox Draw textbox, Pivot Tables / Data Analysis (Insert tab) o Why to use PivotTables? o Student A-midterm and tinal are 6U pts each o Student B-midterm and final are 70 pts each o Student C midterm and final are 80 pts each o Student D midterm and final are 90 pts each o Student E midterm and final are 100 pts each - Create charts-using companies specified in the Sparklines exercise (Walmart, Alibaba, JD, Amazon, Mercado Libre, Sears, Macy, Best Buy), create the following charts: o pie chart which depicts individual company annual revenues (sales) to overall total US retail spending o pie chart which depicts individual company annual revenues (sales) to overall total global (world) retail spending o bar cha rt to compare companies sales to each other o use appropriate chart elements: legends, vertical axis and horizontal axis to label chart data and explanations -Inserting comments - Add comments for each exercise above. How do you navigate forward and backward between comments? - Text boxes (Insert tab) What would be reasons to use textboxes in the spreadsheet (2-3 reasons)? enter text, resize the textbox Draw textbox, Pivot Tables/Data Analysis (Insert tab)- o Why to use PivotTables? o Create Regional Sales worksheet: Sales Rep, Region, Month, Sale, Description (at least 50 entries) o Create PivotTable report based on Regional Sales o Rearrange Fields in a PivotTable o Try PivotTable Report Filter Area o Changing the function in a PivotTable o Display PivotChart 2. Surveys: Google Forms- Marketing/Sales/Customer Support Prepare Survey using Google Forms The survey should have at least 10 questions of at least 5 types. i.e. Multiple choice, Checkboxes, Dropdown, Paragraph, etc The survey should be answered by at least 6 people Form and the results of the survey should be placed into Moodle Once complete, send the form to TA and Instructor via email invite Sprint 7:09 AM a njit2.mrooms.net Homework 2 Advanced Spreadsheets HW 2.docx Examples for Homework 2 Examples - Advanced Spreadsheets.xlsx Examples - Macro.xlsx Examples - Scenarios.xlsx PivotTable Scenario.docx HW2a Adv Spreadsheet Financial Functions Time Value of Money (TVM) Top 10 most valuable global brands 2018 Homework 2 Submission What does BDFL mean? 16 Various Range Textbox Te view Formulas Example ef Conditional Formatting and Comments 20000 Defined Names (Formulas Tab) Data Validation (Data Tab (Home Tab) 20000 10000 Conditional Formating Comments Example of Sparkles (Iasert Tab) Sales: 1st Quarter Symbolic names Jan Feb Mar 867.5 225.9 56.4 900.4 221.6 20.4 914.5 218.1 45.8 What If Analysis Willson Sparklines Jan Feb Mar 867.5 225.9 56.4 900.4 221.6 70.4 914.5 218.1 45.8 Willson Feb Mar 67.5 225.9 56.4 900 4 221.6 70.4 14.5 218.1 45.8 Willson Sprint 7:10 AM njit2.mrooms.net Range Textbox 16 7:10 AM "11 Sprint O njit2.mrooms.net Textbox Various Range 16 "11 Sprint 7:11 AM O njit2.mrooms.net Gross Revenue Cost of Goods Sold 150000 24000 Gross Profit 126000 16 "11 Sprint 7:12 AM njit2.mrooms.net 1. Pivot Table Two resources are listed below: Mac Users: https://www.techonthenet.com/excelpivottbls/create201Lp hp analysis/prvot-tables htm A created pivot table has provided as an example on moodle. 2. scenarios refer to An example is given as shown on Moodle: Screenshots are two scenarios: Worst Cases: 16 Various Range Textbox Te view Formulas Example of Conditional Formatting and Comments 20000 Defined Names (Formulas Tab) Data Validation (Data Tab) (Home Tab) 20000 F2 Net 10000 Conditional Formating Comments Esample of Sparkles (Iasert Tab) Sales: 1st Quarter Symbolic names Jan Feb Mar 867.5 225.9 564 900.4 221.6 20.4 914.5 218.1 45.8 What If Analysis Willson Sparklines Feb Mar 867.5 225.9 56.4 900.4 221.6 70.4 914.5 218.1 45.8 Willson Feb 67.5 225.9 56.4 900 4 221.6 70.4 14.5 218.1 45.8 Willson 7:11 AM "11 Sprint njit2.mrooms.net Sort and Filter Example Qty Total Sum of Qty Brown Evans Jones Grand Tot 20 64 16 "11 Sprint 7:11 AM njit2.mrooms.net Sort and Filter Example Qty Total Sum of Total Total 6071.4 1427.1 4151.4 11649 Brown Jones Grand Total 16 "11 Sprint 7:12 AM njit2.mrooms.net 16 MIS 245 Homework II Productivity tools continued . Advanced Spreadsheets: Excel Businesses, NGO Government Organizations Conditional Formatting (Home tab) o Create income statement with minimum 8 line items. By changing, revenue line item, the income statement may show either profit or loss. Using conditional formatting, mark profit (net income) green; otherwise make it red. -Sparklines o Using publically available data (Google Finance, Yahoo Finance), get 4 quarters of net income / loss for the following commerce retail companies: Wallmart, Alibaba, JD, Amazon, Mercado Libre, Sears, Macy Best Buy. Based on 4 quarters data, using sparklines, please depict trend. Show both line sparklines and column sparklines. - Mortgage calculation- calculate monthly mortgage using Excel build-in function o Variables to be used: M monthly mortgage payment. P the principal, or the initial amount you borrowed iyour monthly interest rate. Your lender likely lists interest rates as an annual figure so you'll need to divide by 12, for each month of the year n the number of payments over the life of the loan Financial functions (Formulas tab). Choose 6 financial functions. For each function, create an example. Explain why did you choose specific function and how it is useful - VLookup function-finds a value in the named range and o Create named range which will contain 50 students city, state, zip. Using VLookup function search for i.e. what problems does it solve returns with the found value records: first name, last name, ssn, cel phone, street, student's ssn and search for first name. What is Financial functions (Formulas tab). Choose 6 financial functions. For each function, create an example. Explain i.e. what problems does it solve returns with the found value why did you choose specific function and how it is useful - VLookup function finds a value in the named range and o Create named range which will contain 50 students records: first name, last name, ssn, cel phone, street, city, state, zip. Using VLookup function search for student's ssn and search for first name. What is displayed when data is found and what is displayed when data is not found. Give 2 practical examples to use VLookup function -"IF" Logical function-calculate grade using 'IF' function assuming the following: o use MIS 245 syllabus for course weighing scheme - for weight distribution and NJIT recommended grading scheme for grade cutoff o Each student has HW 85 pts out of 100 o Each student has Project-90 pts out of 100 o Homework for all the students o Student A-midterm and final are 60 pts each o Student B midterm and final are 70 pts each o Student C-midterm and final are 80 pts each o Student D midterm and final are 90 pts each o Student E midterm and final are 100 pts each Create charts- using companies specified in the Sparklines exercise (Walmart, Alibaba, JD, Amazon, Mercado Libre, Sears, Macy, Best Buy), create the following charts: o pie chart which depicts individual company annual revenues (sales) to overall total US retail spending o pie chart which depicts individual company annual revenues (sales) to overall total global (world) retail o bar chart t o compare companies sales to each other o use appropriate chart elements: legends, vertical axis and horizontal axis to label chart data and explanations - Inserting comments- Add comments for each exercise above. How do you navigate forward and backward between comments? -Text boxes (Insert tab)-What would be reasons to use textboxes in the spreadsheet (2-3 reasons)? enter text, resize the textbox Draw textbox, Pivot Tables / Data Analysis (Insert tab) o Why to use PivotTables? o Student A-midterm and tinal are 6U pts each o Student B-midterm and final are 70 pts each o Student C midterm and final are 80 pts each o Student D midterm and final are 90 pts each o Student E midterm and final are 100 pts each - Create charts-using companies specified in the Sparklines exercise (Walmart, Alibaba, JD, Amazon, Mercado Libre, Sears, Macy, Best Buy), create the following charts: o pie chart which depicts individual company annual revenues (sales) to overall total US retail spending o pie chart which depicts individual company annual revenues (sales) to overall total global (world) retail spending o bar cha rt to compare companies sales to each other o use appropriate chart elements: legends, vertical axis and horizontal axis to label chart data and explanations -Inserting comments - Add comments for each exercise above. How do you navigate forward and backward between comments? - Text boxes (Insert tab) What would be reasons to use textboxes in the spreadsheet (2-3 reasons)? enter text, resize the textbox Draw textbox, Pivot Tables/Data Analysis (Insert tab)- o Why to use PivotTables? o Create Regional Sales worksheet: Sales Rep, Region, Month, Sale, Description (at least 50 entries) o Create PivotTable report based on Regional Sales o Rearrange Fields in a PivotTable o Try PivotTable Report Filter Area o Changing the function in a PivotTable o Display PivotChart 2. Surveys: Google Forms- Marketing/Sales/Customer Support Prepare Survey using Google Forms The survey should have at least 10 questions of at least 5 types. i.e. Multiple choice, Checkboxes, Dropdown, Paragraph, etc The survey should be answered by at least 6 people Form and the results of the survey should be placed into Moodle Once complete, send the form to TA and Instructor via email invite Sprint 7:09 AM a njit2.mrooms.net Homework 2 Advanced Spreadsheets HW 2.docx Examples for Homework 2 Examples - Advanced Spreadsheets.xlsx Examples - Macro.xlsx Examples - Scenarios.xlsx PivotTable Scenario.docx HW2a Adv Spreadsheet Financial Functions Time Value of Money (TVM) Top 10 most valuable global brands 2018 Homework 2 Submission What does BDFL mean? 16 Various Range Textbox Te view Formulas Example ef Conditional Formatting and Comments 20000 Defined Names (Formulas Tab) Data Validation (Data Tab (Home Tab) 20000 10000 Conditional Formating Comments Example of Sparkles (Iasert Tab) Sales: 1st Quarter Symbolic names Jan Feb Mar 867.5 225.9 56.4 900.4 221.6 20.4 914.5 218.1 45.8 What If Analysis Willson Sparklines Jan Feb Mar 867.5 225.9 56.4 900.4 221.6 70.4 914.5 218.1 45.8 Willson Feb Mar 67.5 225.9 56.4 900 4 221.6 70.4 14.5 218.1 45.8 Willson Sprint 7:10 AM njit2.mrooms.net Range Textbox 16 7:10 AM "11 Sprint O njit2.mrooms.net Textbox Various Range 16 "11 Sprint 7:11 AM O njit2.mrooms.net Gross Revenue Cost of Goods Sold 150000 24000 Gross Profit 126000 16 "11 Sprint 7:12 AM njit2.mrooms.net 1. Pivot Table Two resources are listed below: Mac Users: https://www.techonthenet.com/excelpivottbls/create201Lp hp analysis/prvot-tables htm A created pivot table has provided as an example on moodle. 2. scenarios refer to An example is given as shown on Moodle: Screenshots are two scenarios: Worst Cases: 16 Various Range Textbox Te view Formulas Example of Conditional Formatting and Comments 20000 Defined Names (Formulas Tab) Data Validation (Data Tab) (Home Tab) 20000 F2 Net 10000 Conditional Formating Comments Esample of Sparkles (Iasert Tab) Sales: 1st Quarter Symbolic names Jan Feb Mar 867.5 225.9 564 900.4 221.6 20.4 914.5 218.1 45.8 What If Analysis Willson Sparklines Feb Mar 867.5 225.9 56.4 900.4 221.6 70.4 914.5 218.1 45.8 Willson Feb 67.5 225.9 56.4 900 4 221.6 70.4 14.5 218.1 45.8 Willson 7:11 AM "11 Sprint njit2.mrooms.net Sort and Filter Example Qty Total Sum of Qty Brown Evans Jones Grand Tot 20 64 16 "11 Sprint 7:11 AM njit2.mrooms.net Sort and Filter Example Qty Total Sum of Total Total 6071.4 1427.1 4151.4 11649 Brown Jones Grand Total 16 "11 Sprint 7:12 AM njit2.mrooms.net 16
Step by Step Solution
There are 3 Steps involved in it

Get step-by-step solutions from verified subject matter experts