

Question: Please, I need your help with it. I need all the detailed explanations. Thank you.There is no issue to these Consider the following example and
Please, I need your help with it. I need all the detailed explanations. Thank you.There is no issue to these
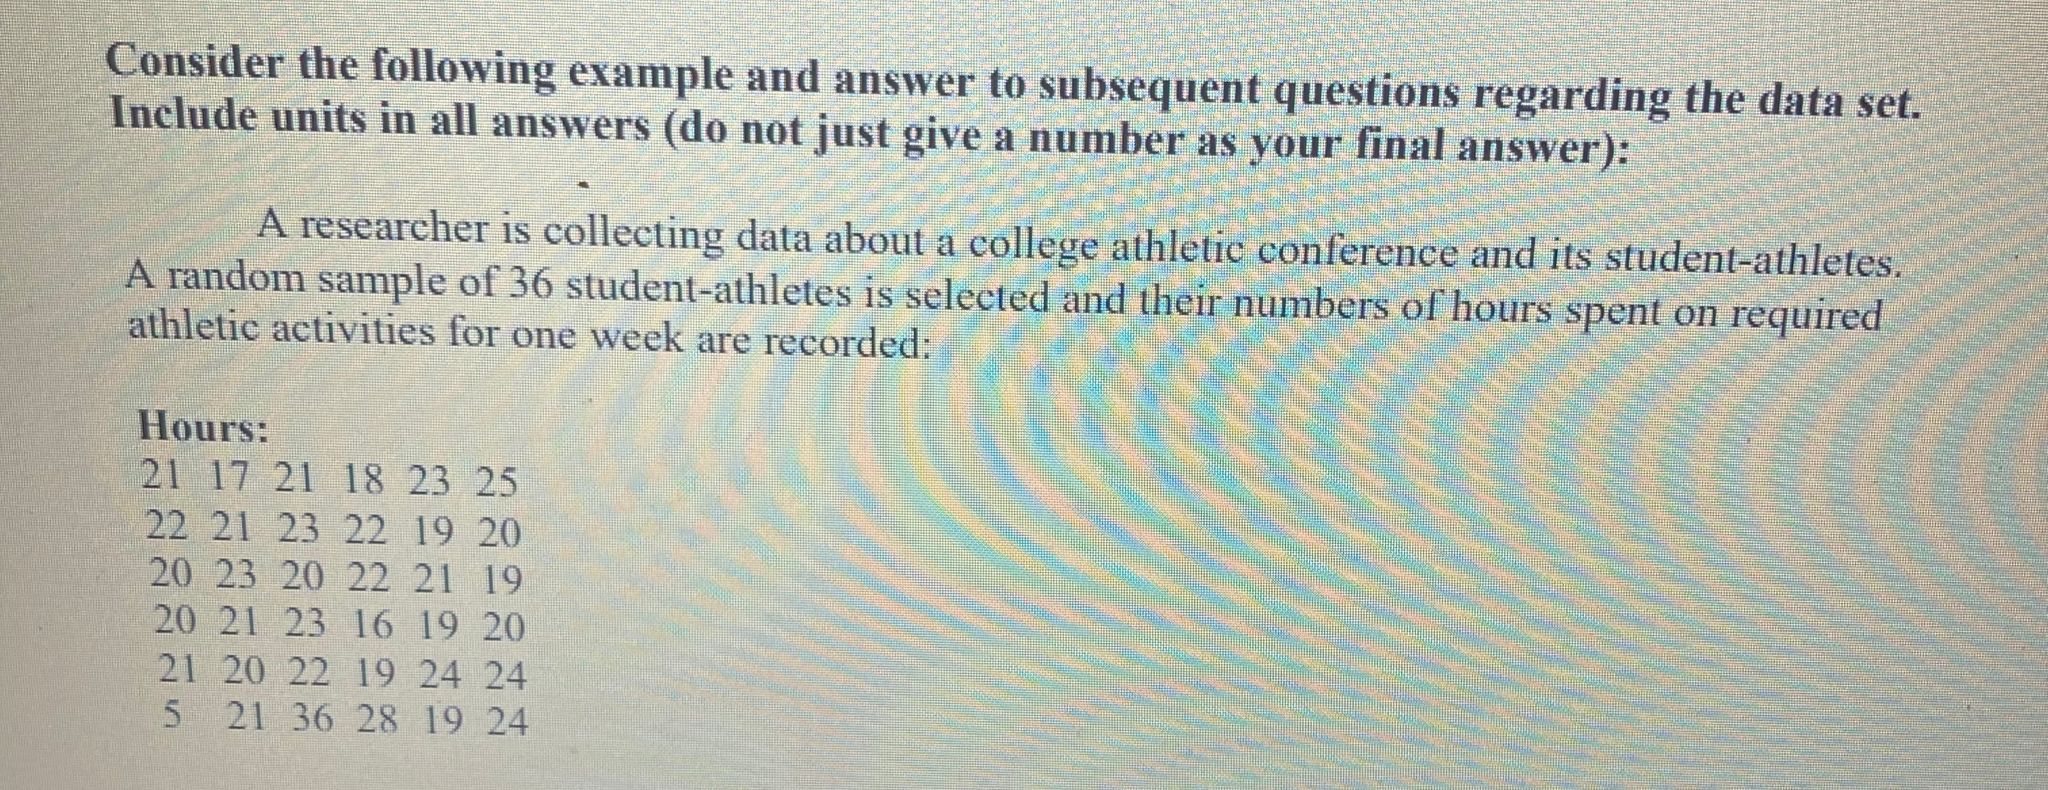
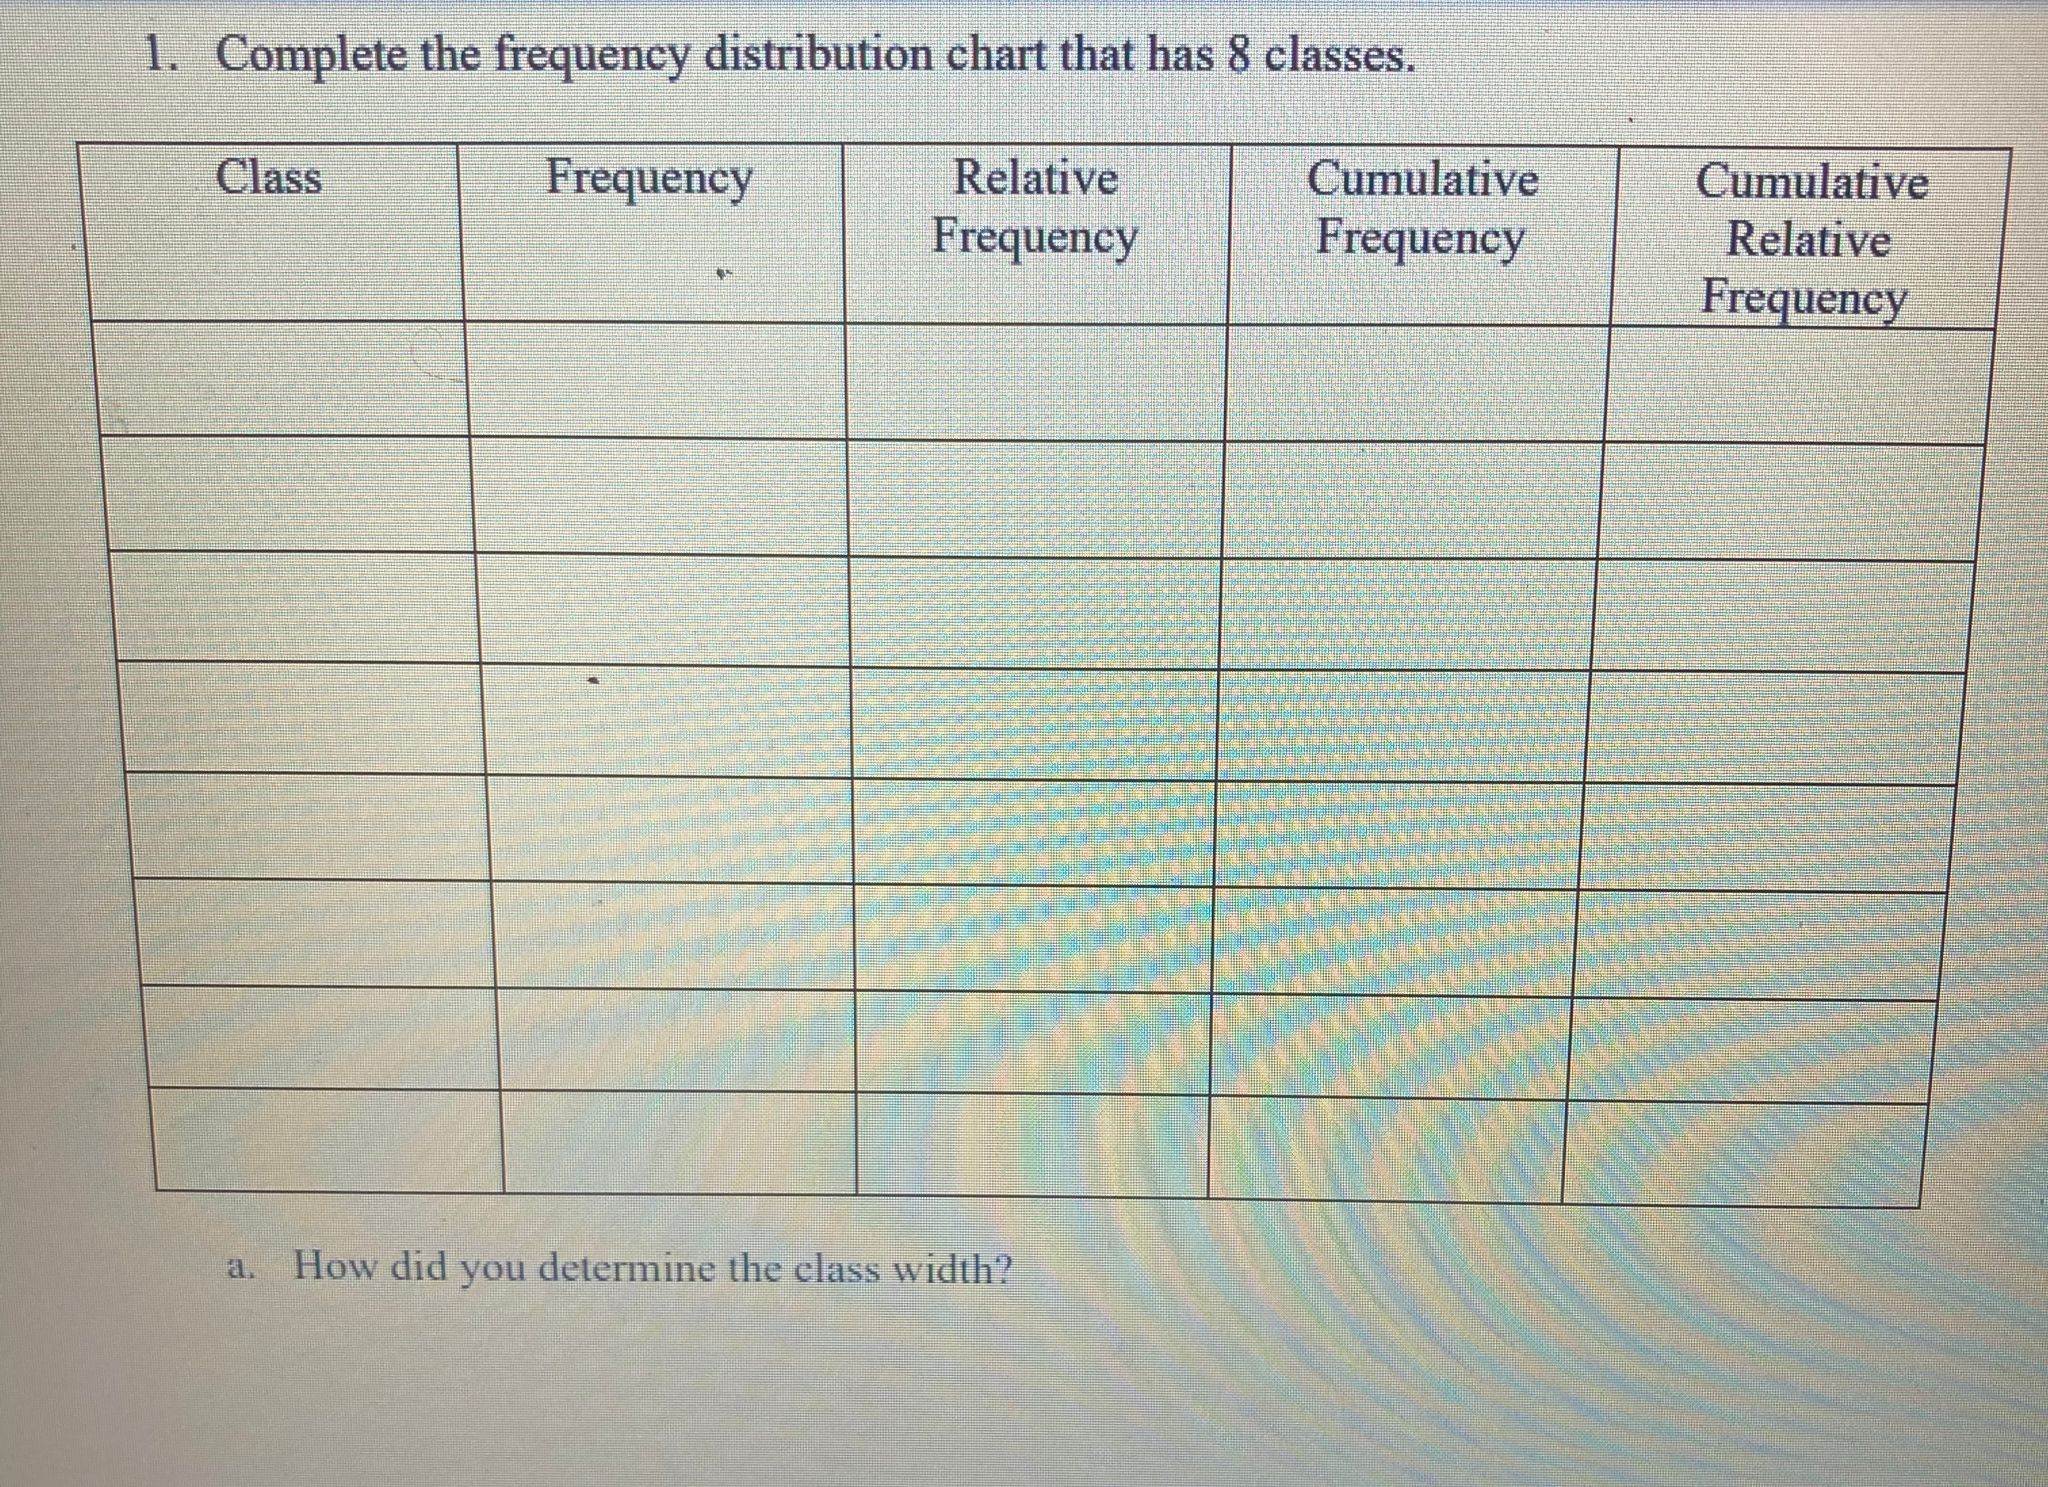
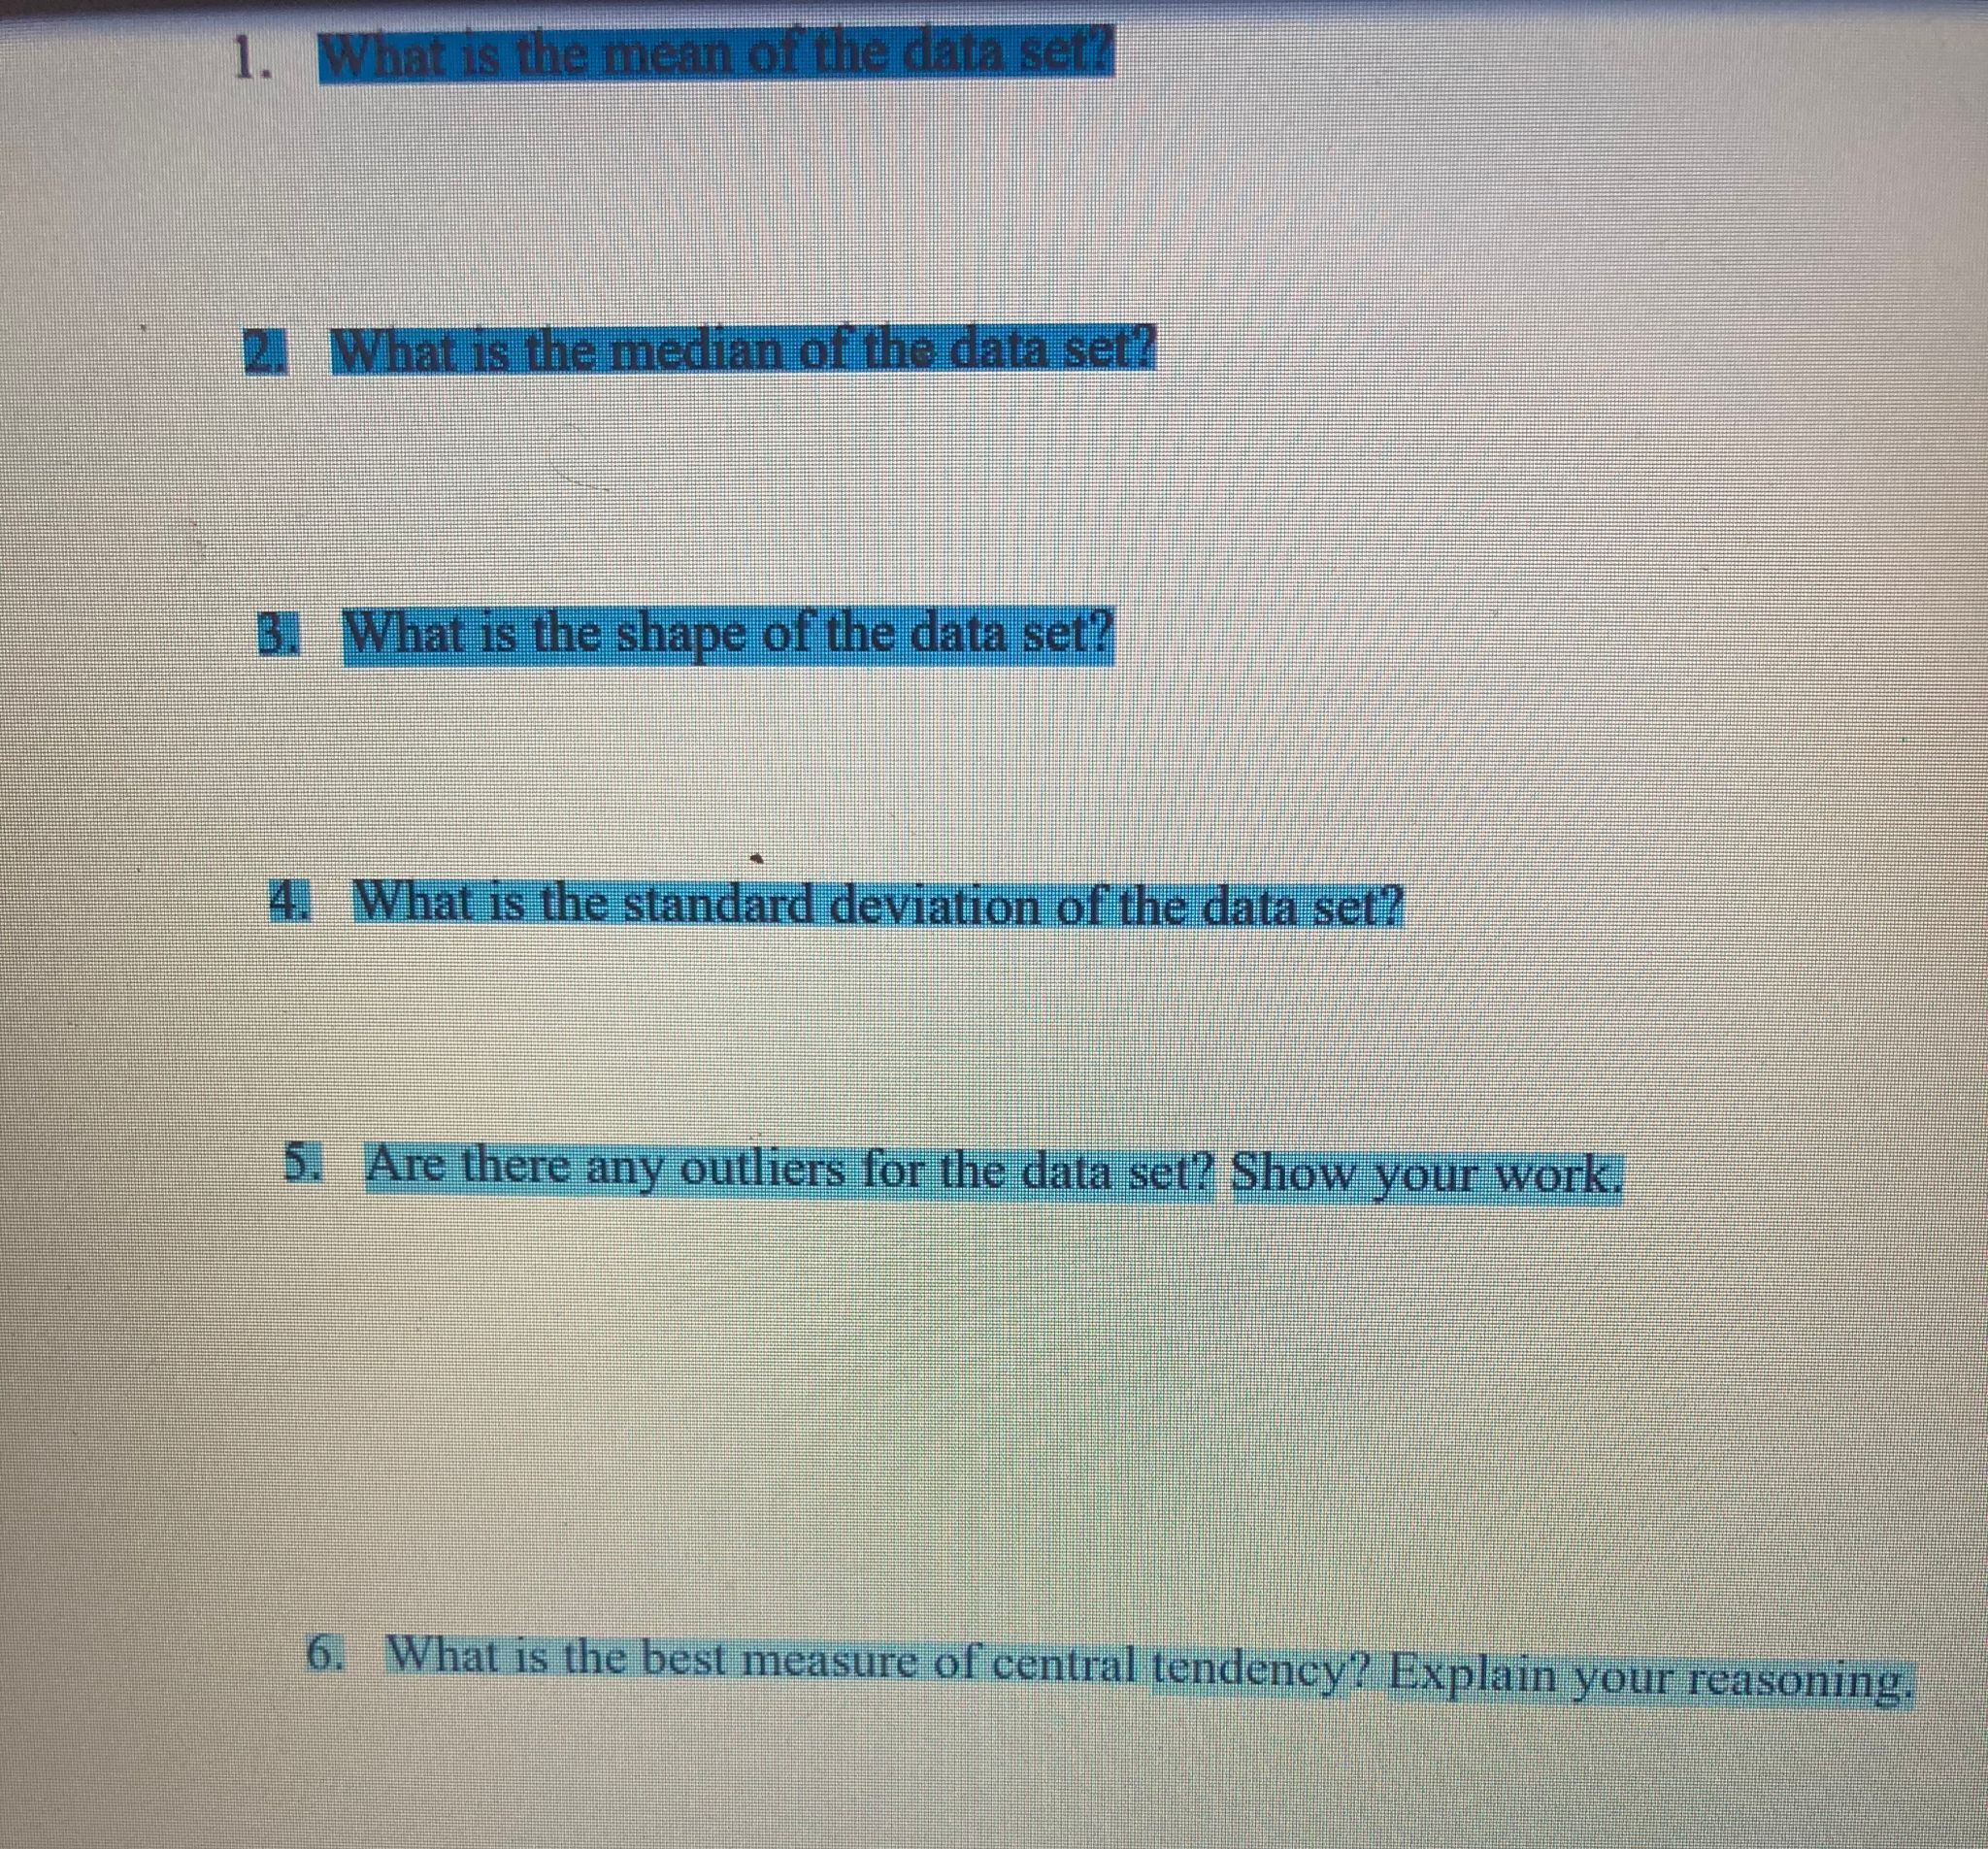
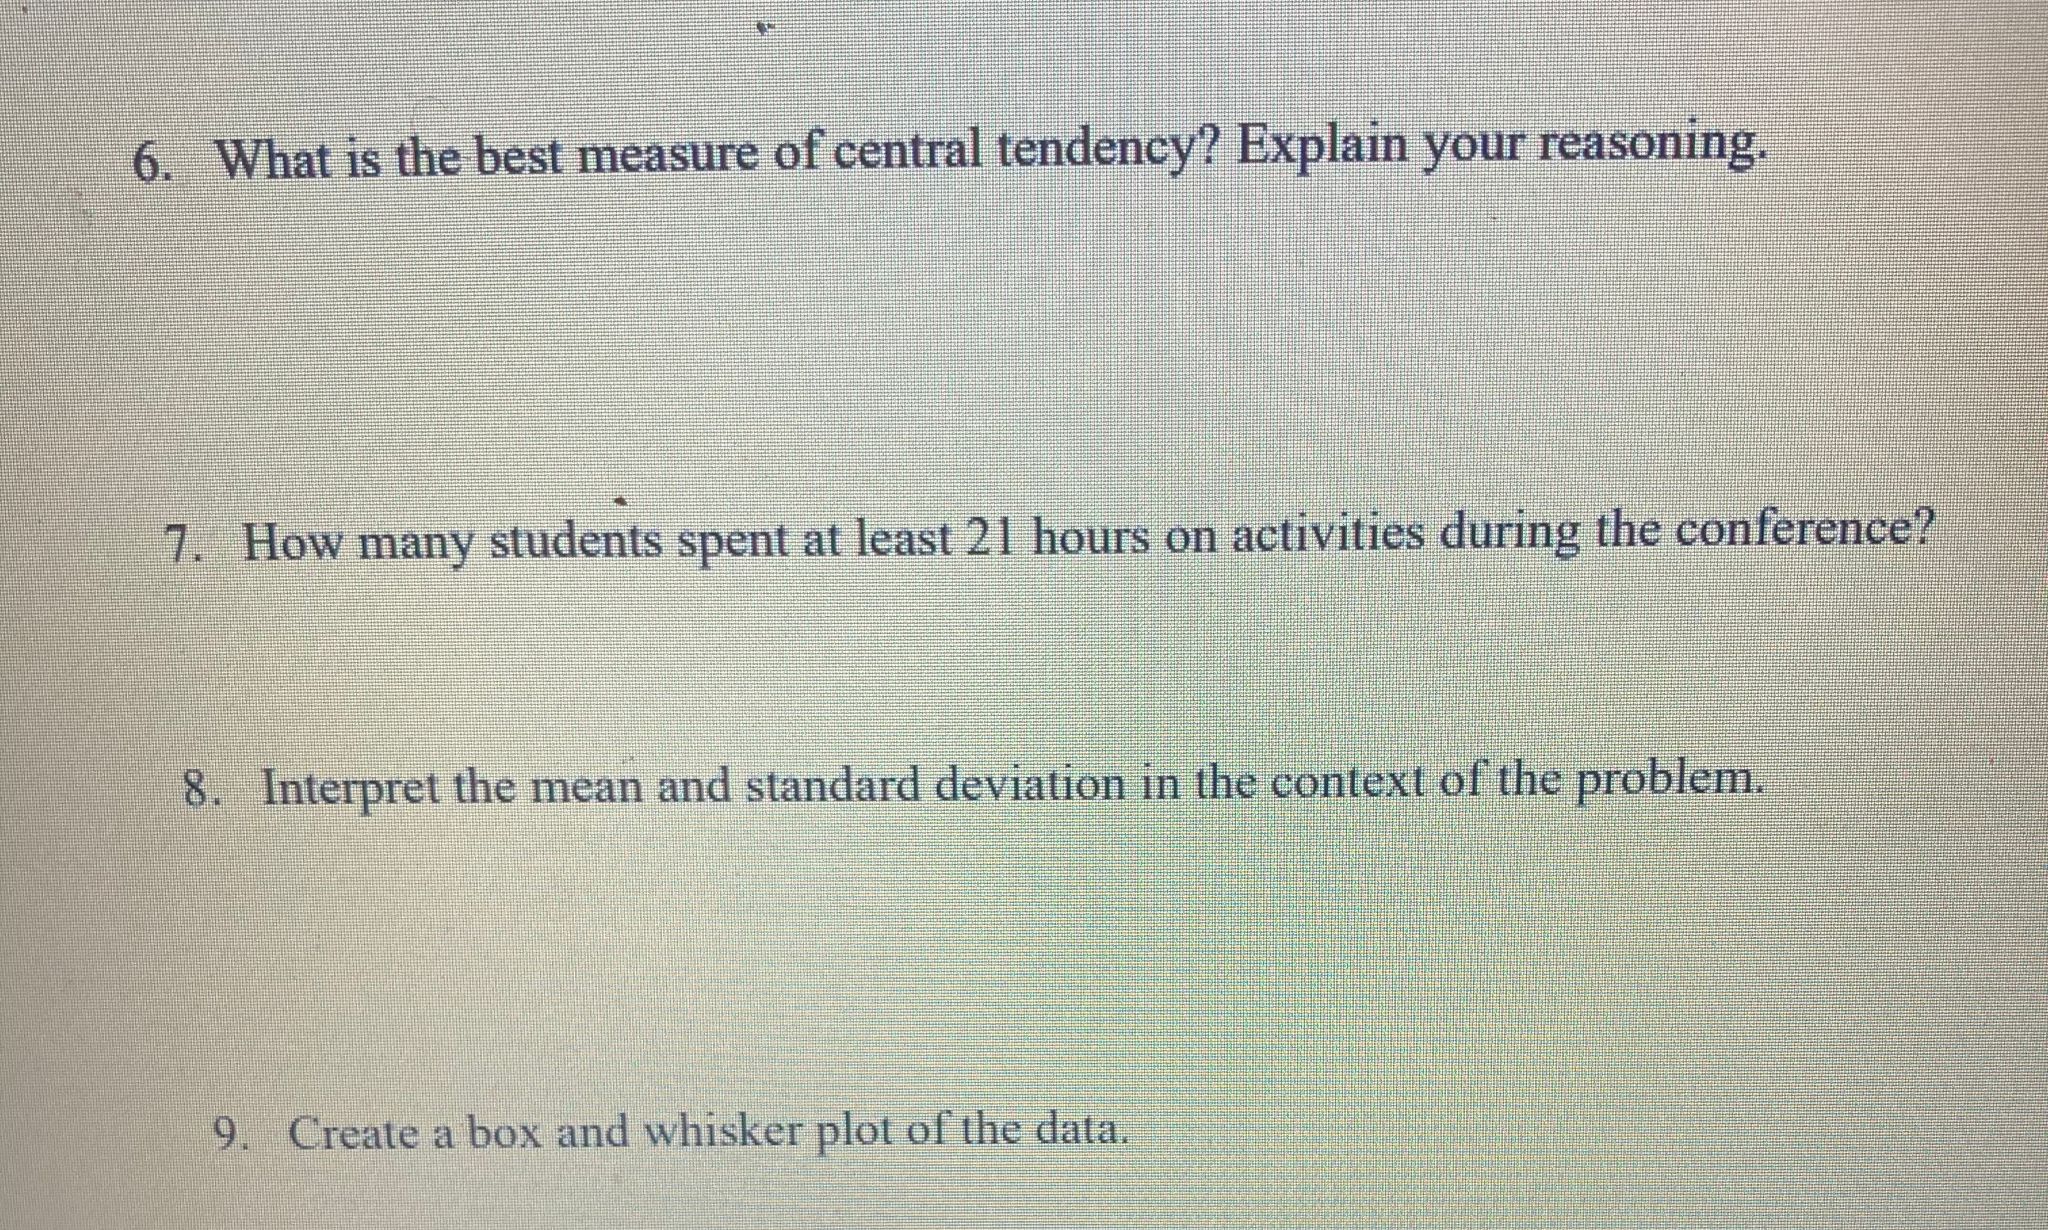
Consider the following example and answer to subsequent questions regarding the data set. Include units in all answers (do not just give a number as your final answer): A researcher is collecting data about a college athletic conference and its student-athletes. A random sample of 36 student-athletes is selected and their numbers of hours spent on required athletic activities for one week are recorded: Hours: 21 17 21 18 23 25 22 21 23 22 19 20 20 23 20 22 21 19 20 21 23 16 19 20 21 20 22 19 24 24 5 21 36 28 19 241. Complete the frequency distribution chart that has 8 classes. Class Frequency Relative Cumulative Cumulative Frequency Frequency Relative Frequency a. How did you determine the class width?1. What is the mean of the data set? What is the median of the data set? What is the shape of the data set? 4. What is the standard deviation of the data set? 5. Are there any outliers for the data set? Show your work. 6. What is the best measure of central tendency? Explain your reasoning.6. What is the best measure of central tendency? Explain your reasoning 7. How many students spent at least 21 hours on activities during the conference? 8. Interpret the mean and standard deviation in the context of the problem. 9. Create a box and whisker plot of the data.1. Create a probability distribution table of the data using each class as your 'x' values: 2. Verify that this is indeed a probability distribution. 3. What is the probability that a randomly selected student participates in at least 17 hours of activities? 4. What is the probability that a randomly selected student participates in less than 21 hours of activities?4. What is the probability that a randomly selected student participates in less than 21 hours of activities? 5. What is the probability that a randomly select student participates in more than 17 hours in activities but less than 13 hours?1. Given the information that you have, if you were to create a confidence interval for the mean of hours spent on activities for all students attending the conference, would this be a standard normal distribution or a t-distribution? How do you know? 2. Verify that we can use this method to create a confidence interval for the mean. 3. Construct a 95% confidence interval for the mean number of hours spent on activities at the conference. a. What are the critical values? b. What is the margin of error?a. What are the critical values? b. What is the margin of error? c. What could the researchers have done to reduce the margin of error? d. Give an interpretation for the confidence interval that you constructed
Step by Step Solution
There are 3 Steps involved in it

Get step-by-step solutions from verified subject matter experts