

Question: please I really need help and be clear please please help me and be clear please please need help hope this picture is clear 4.
please I really need help and be clear please 
please help me and be clear please 
please need help
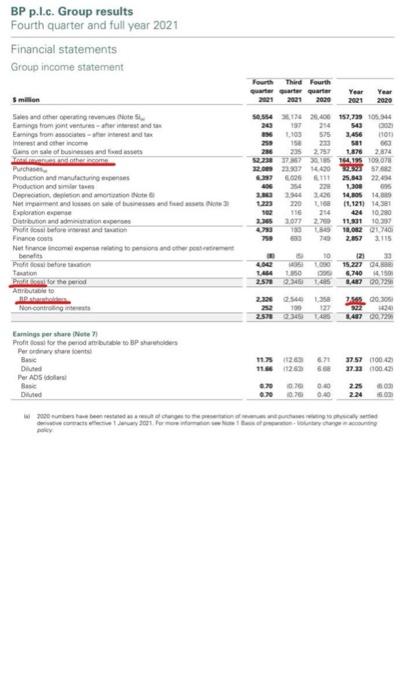
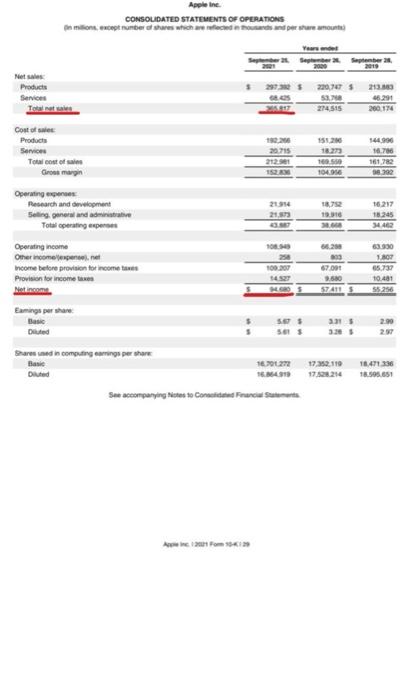
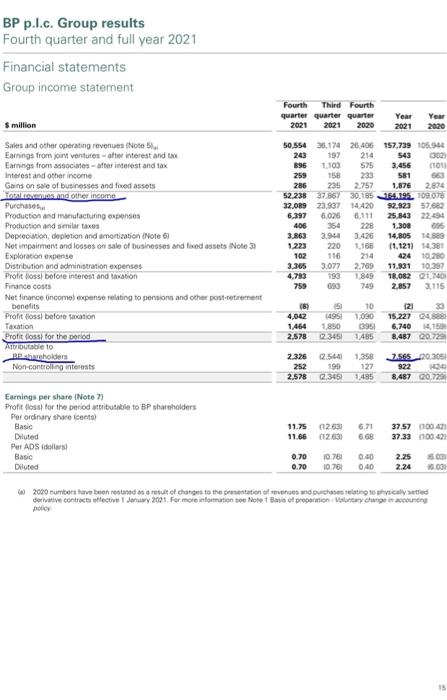
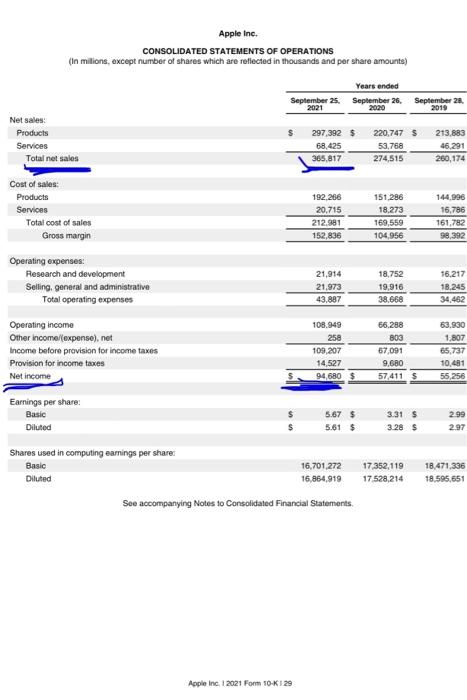
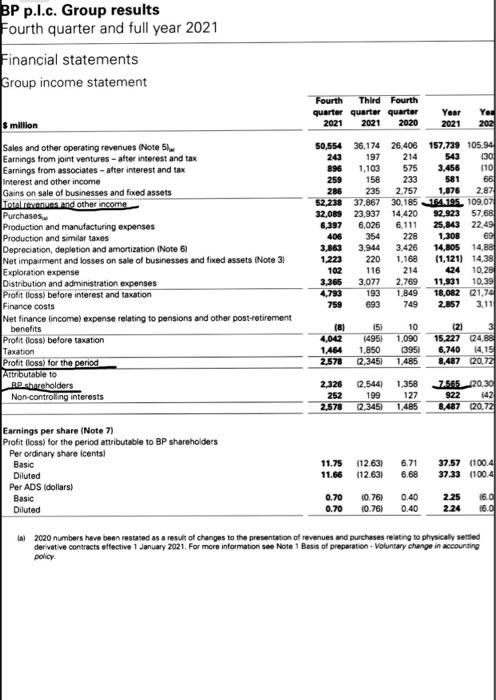
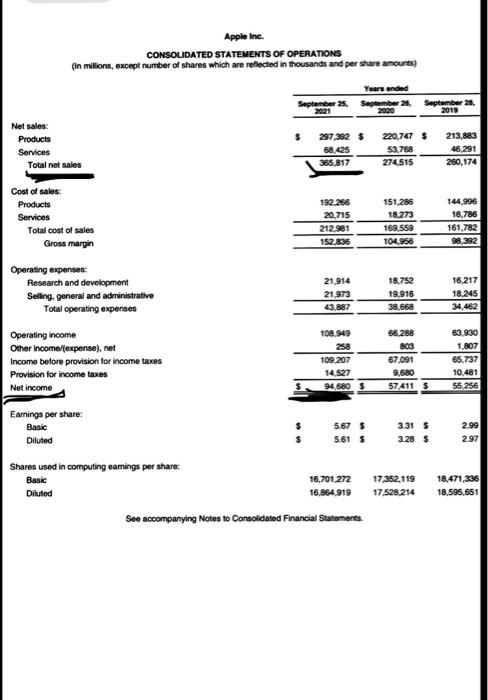
4. Please analyse the net profit margin of Apple and BP according to the tables on the next page, then comment on why Apple's net profit margin of 26% is higher compared to BP's net profit margin of 4.6%. (see the attachments) BP p.1.c. Group results Fourth quarter and full year 2021 Financial statements Group income statement million and others Earnings tromonteurs estanda Earnings from the rest and te Interest and the Carns on sale of businesses and feed Purchase Production and manufacturing Production and Depreciation and on Exploration expense Net romanticos se on and oto Duration and administration experim Protofore west and to France Netfance income to persons and other ben Pretorno Taxation Youth Third Fourth water water quarter Year Year 2021 2021 2020 2021 2020 50,554 2,400 157,729 105.544 26 15 14 543 10 575 1.456 Hon 158 01 288 235 2.75 1876 2874 1223 777 015 14.125 09.07 12.02.07 49 50 111 25,543 22454 400 300 2. 14.05 1 220 LI 11.1211 141 102 110 214 424 10,280 307 2.0 11.301 10. 100 18.082 440 2052 1115 10 LA 225 150 000 (2) 13 15.223 04 6.40 1.150 1,47 0,72 Annotato Non contro 2.3285435 100 127 25700345 33 00:00 24 Earnings per share Note 7 Profit food for the period to BP se Peray store Base D Per ADS Dad 1126 6 17.57 1100 22 00.42 0.0 0.0 0.0 2.25 0 0.70 0.40 2.24 - han a states como Appletne CONSOLIDATED STATEMENTS OF OPERATIONS milions werber shares which are che Yoursel September 2019 Net Products Service 2975 220,745 53 274545 23.00 46.291 200.174 Cost of sales Products Services Total cost of Grosmarin 20715 2121 144.300 16.700 161.782 100SSO 10A.DE Operating Research and development Selling general and me Total operating exper 2014 21.5 19:10 16.217 18.245 34462 108. Operating income Other complet Income before provision for income taxes Provision for income 108 207 14 66.20 103 67001 9.500 574113 3.930 1.802 65.737 10.481 55256 Earings per share ses $ 5 2.00 2.57 Duted 17211 shares wed in computing as per the Basic D 16.64.31 See accompanying his so considered Financial Statements 10 18.471336 18.595.651 4. Please analyse the net profit margin of Apple and BP according to the tables on the next page, then comment on why Apple's net profit margin of 26% is higher compared to BP's net profit margin of 4.6%. (see the attachments) BP p.1.c. Group results Fourth quarter and full year 2021 Financial statements Group income statement Fourth Third Fourth quarter quarter quarter 2021 2021 2020 $ million Year 2021 Year 2020 Sales and other operating revenues Note 5 Earnings from joint ventures atter interest and tax Earnings from associates after interest and tax Interest and other income Gains on sale of businesses and food assets Tatalonies and other income Purchases Production and manufacturing expenses Production and similar taxes Depreciation, depletion and amortization Note Net impairment and losses on sale of businesses and fixed assets Note 3 Exploration expense Distribution and administration expenses Profit loss before interest and tation Finance costs Net finance incomal expense relating to pensions and other post-retirement benefits Profit is before con Taxation Profit oss for the period Attributable to BP beholders Non-controlling interests 50,554 36.174 26.406 157,739 105.94 243 197 214 543 3003 896 1.103 575 3,456 cou 259 158 233 581 663 286 235 2.757 1.876 2,874 52.238 3785730185 164.195.109.078 32.089 23.937 14420 92.923 57.602 6.397 6,026 25,843 22.494 406 354 228 1,308 696 3.863 3.944 3.426 14.8051459 1.223 220 1.168 11,1211 14.30 102 116 214 424 10.280 3.365 3.077 2.789 11.931 10.27 4793 190 1849 18.082 2140 759 630 749 2,857 3.115 6.111 (8) 151 10 4,042 14951090 1,464 1850 3951 2.578 23456 1485 (21 15.227 24896 6.740 14,150 8,487 20.729 2.325 2.5441.358 127 2.578 2.34521.485 2.56520.305 00 8,487 20.72 Earnings per share Note 7 Profit oss for the period attributable to BP shareholders Per ordinary share fonts Basic Diluted Per ADS dollars Basic Diluted 11.75 11.66 6231 012631 6.71 6.68 37.57 00047 37.33 11004 0.70 0.70 10.761 10.761 GAD 0.40 2.25 2.24 5.000 W 2000 rumborave been restored as a result of changes to the presentation of revenues and purchases relating to called derivative contracts offective January 2021. For more informations Note Basis of preportion Voluntary charger courg policy 15 Apple Inc. CONSOLIDATED STATEMENTS OF OPERATIONS (In milions, except number of shares which are reflected in thousands and per share amounts) Years ended September 25. September 26. September 28, 2021 2015 Net sales: Products Services Total net sales 297 3925 68.425 365,817 220,747 S 53.768 274,515 213.883 46.291 260,174 Cost of sales: Products Services Total cost of sales Gross margin 192,266 20,715 212.381 152,836 151.286 18.273 169,559 104.956 144.906 16,786 161.782 98.392 Operating expenses: Research and development Selling, general and administrative Total operating expenses 21,914 21.973 43.887 18,752 19,916 38.668 16,217 18.245 34.462 Operating income Other income/expense), net Income before provision for income taxes Provision for income taxes Net income 108.949 258 109,207 14.527 94,680 $ 66.288 803 67,091 9,680 57,411 $ 63.930 1.807 65.737 10.481 55,256 Earnings per share: Basic Diluted 2.99 5.67 $ 5.61 $ 3.31 $ 3.28 $ 297 Shares used in computing earnings per shares Basic 16,701,272 Diluted 16,864,919 See accompanying Notes to Consolidated Financial Statements 17352, 119 17 528,214 18,471,336 18.595,651 Apple Inc. 2021 Form 10-K 29 4. Please analyse the net profit margin of Apple and BP according to the tables on the next page, then comment on why Apple's net profit margin of 26% is higher compared to BP's net profit margin of 4.6%. (see the attachments) BP p.1.c. Group results Fourth quarter and full year 2021 Financial statements Group income statement Fourth Third Fourth quarter quarter quarter 2021 2021 2020 Yor Year 2021 $ million 202 198 Sales and other operating revenues (Note 5 Earnings from joint ventures - after interest and tax Earnings from associates after interest and tax Interest and other income Gains on sale of businesses and fixed assets Total revenues and other income Purchases Production and manufacturing expenses Production and similar taxes Depreciation, depletion and amortization (Note 6) Net impairment and losses on sale of businesses and fixed assets (Note 3 Exploration expense Distribution and administration expenses Profit foss) before interest and taxation Finance costs Net finance income) expense relating to pensions and other post-retirement benefits Profit loss) before taxation Taxation Profit foss) for the period Attributable to BB shareholders Non-controlling interests 50,554 36,174 26.406 157.739 105.94 243 197 214 543 130 1,103 575 3,456 110 259 158 233 581 66 286 235 2.757 1,876 2.87 52,238 37,867 30,185 164.195 109.07 32,069 23,937 14.420 92.923 57.68 6,397 6,026 6,111 25,843 22.49 406 354 228 1,308 691 3,863 3.944 3,426 14,805 14,88 1.223 220 1.168 (1,121) 14,38 102 116 214 424 10,28 3,365 3,077 2.769 11,931 10.39 4,793 193 1849 18,082 21,74 759 693 749 2.857 3.11 (8) 4,042 1.464 2.578 151 (495) 10 1,090 (395) 1,485 (2) 31 15,227 24.88 6,740 14,15 8,487 (20,72 1,850 2,345) 2,326 252 2.578 (2.544) 199 2,3451 1,358 127 1,485 7.565 /20.30 922 (42 8,487 (20.72 Earnings per share (Note 7) Profit loss) for the period attributable to BP shareholders Per ordinary share tcents! Basic Diluted Per ADS (dollars) Basic Diluted 11.75 11.66 (12.631 (12.631 6.71 6.68 37.57 (100.4 37.33 (100.4 10.78 0.40 0.70 0.70 2.25 2.24 16.0 16.0 10.76) 0.40 tal 2020 numbers have been restated as a result of changes to the presentation of revenues and purchases relating to physically settled derivative contracts effective 1 January 2021. For more information see Note 1 Basis of preparation - Voluntary change in accounting policy Apple Inc. CONSOLIDATED STATEMENTS OF OPERATIONS (In milions, except number of shares which are reflected in thousands and per share amounts) September 2021 Years ended September 2020 September 26 2019 Net sales Products Services Total net sales 297.302 $ 68.425 365,817 220,747 $ 52,768 274,515 213,883 46,291 260,174 Cost of sales: Products Services Total cost of sales Gross margin 192.266 20,715 212.981 152.836 151.288 18.273 169.559 104.956 144.996 16,786 161,782 98,382 Operating expenses Research and development Selling general and administrative Total operating expenses 21,914 21,973 43.887 18.752 19,916 38.668 16.217 18.245 34.462 Operating income Other Income (expense), net Income before provision for income taxes Provision for income taxes Net Income 108.949 258 109207 14.527 94.680 66.288 803 67,091 9,680 57,411 $ 63.930 1.807 65.737 10.481 55.256 Earnings per share: Basic Diluted $ 5.67 $ 5.61 $ 3.31 $ 3.28 $ 2.99 2.97 Shares used in computing camings per share: Basic 16,701 272 Diluted 16,854,919 See accompanying Notes to Consolidated Financial Statements 17 352, 119 17.528.214 18,471,336 18,596,651 hope this picture is clear 
Step by Step Solution
There are 3 Steps involved in it
1 Expert Approved Answer
Step: 1 Unlock

Question Has Been Solved by an Expert!
Get step-by-step solutions from verified subject matter experts
Step: 2 Unlock
Step: 3 Unlock