

Question: Please, I want a complete solution to the question, with an explanation of how to solve it Please please please Data Set: New Passenger Cars
Please, I want a complete solution to the question, with an explanation of how to solve it
Please please please
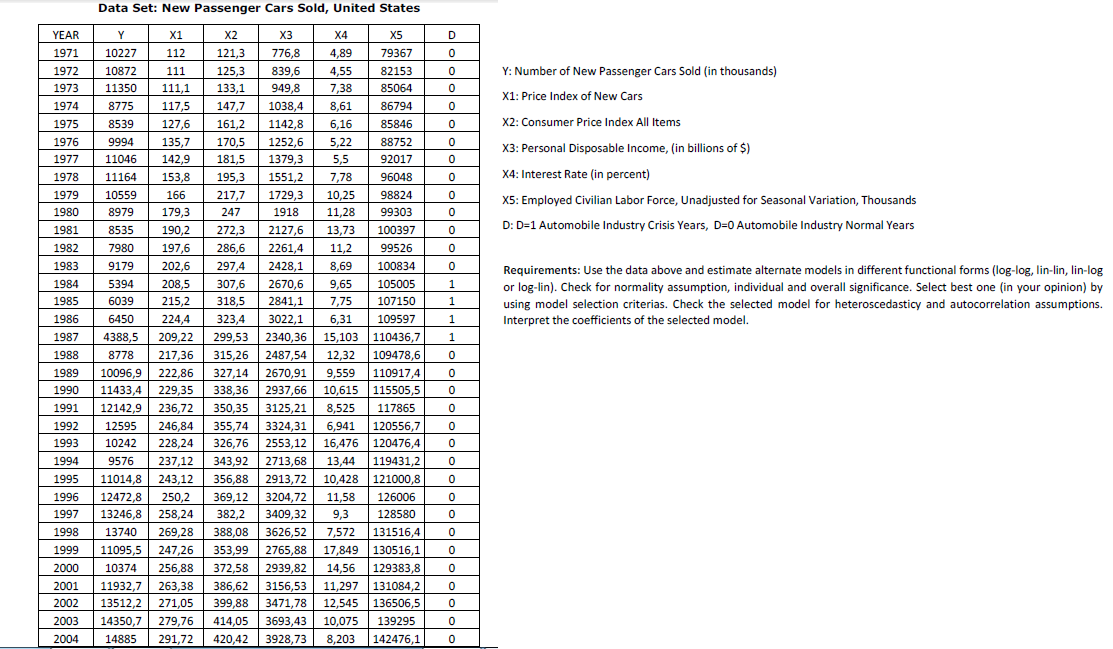
Data Set: New Passenger Cars Sold, United State
| YEAR | Y | X1 | X2 | X3 | X4 | X5 | D |
| 1971 | 10227 | 112 | 121,3 | 776,8 | 4,89 | 79367 | 0 |
| 1972 | 10872 | 111 | 125,3 | 839,6 | 4,55 | 82153 | 0 |
| 1973 | 11350 | 111,1 | 133,1 | 949,8 | 7,38 | 85064 | 0 |
| 1974 | 8775 | 117,5 | 147,7 | 1038,4 | 8,61 | 86794 | 0 |
| 1975 | 8539 | 127,6 | 161,2 | 1142,8 | 6,16 | 85846 | 0 |
| 1976 | 9994 | 135,7 | 170,5 | 1252,6 | 5,22 | 88752 | 0 |
| 1977 | 11046 | 142,9 | 181,5 | 1379,3 | 5,5 | 92017 | 0 |
| 1978 | 11164 | 153,8 | 195,3 | 1551,2 | 7,78 | 96048 | 0 |
| 1979 | 10559 | 166 | 217,7 | 1729,3 | 10,25 | 98824 | 0 |
| 1980 | 8979 | 179,3 | 247 | 1918 | 11,28 | 99303 | 0 |
| 1981 | 8535 | 190,2 | 272,3 | 2127,6 | 13,73 | 100397 | 0 |
| 1982 | 7980 | 197,6 | 286,6 | 2261,4 | 11,2 | 99526 | 0 |
| 1983 | 9179 | 202,6 | 297,4 | 2428,1 | 8,69 | 100834 | 0 |
| 1984 | 5394 | 208,5 | 307,6 | 2670,6 | 9,65 | 105005 | 1 |
| 1985 | 6039 | 215,2 | 318,5 | 2841,1 | 7,75 | 107150 | 1 |
| 1986 | 6450 | 224,4 | 323,4 | 3022,1 | 6,31 | 109597 | 1 |
| 1987 | 4388,5 | 209,22 | 299,53 | 2340,36 | 15,103 | 110436,7 | 1 |
| 1988 | 8778 | 217,36 | 315,26 | 2487,54 | 12,32 | 109478,6 | 0 |
| 1989 | 10096,9 | 222,86 | 327,14 | 2670,91 | 9,559 | 110917,4 | 0 |
| 1990 | 11433,4 | 229,35 | 338,36 | 2937,66 | 10,615 | 115505,5 | 0 |
| 1991 | 12142,9 | 236,72 | 350,35 | 3125,21 | 8,525 | 117865 | 0 |
| 1992 | 12595 | 246,84 | 355,74 | 3324,31 | 6,941 | 120556,7 | 0 |
| 1993 | 10242 | 228,24 | 326,76 | 2553,12 | 16,476 | 120476,4 | 0 |
| 1994 | 9576 | 237,12 | 343,92 | 2713,68 | 13,44 | 119431,2 | 0 |
| 1995 | 11014,8 | 243,12 | 356,88 | 2913,72 | 10,428 | 121000,8 | 0 |
| 1996 | 12472,8 | 250,2 | 369,12 | 3204,72 | 11,58 | 126006 | 0 |
| 1997 | 13246,8 | 258,24 | 382,2 | 3409,32 | 9,3 | 128580 | 0 |
| 1998 | 13740 | 269,28 | 388,08 | 3626,52 | 7,572 | 131516,4 | 0 |
| 1999 | 11095,5 | 247,26 | 353,99 | 2765,88 | 17,849 | 130516,1 | 0 |
| 2000 | 10374 | 256,88 | 372,58 | 2939,82 | 14,56 | 129383,8 | 0 |
| 2001 | 11932,7 | 263,38 | 386,62 | 3156,53 | 11,297 | 131084,2 | 0 |
| 2002 | 13512,2 | 271,05 | 399,88 | 3471,78 | 12,545 | 136506,5 | 0 |
| 2003 | 14350,7 | 279,76 | 414,05 | 3693,43 | 10,075 | 139295 | 0 |
| 2004 | 14885 | 291,72 | 420,42 | 3928,73 | 8,203 | 142476,1 | 0 |
Y: Number of New Passenger Cars Sold (in thousands)
X1: Price Index of New Cars
X2: Consumer Price Index All Items
X3: Personal Disposable Income, (in billions of $)
X4: Interest Rate (in percent)
X5: Employed Civilian Labor Force, Unadjusted for Seasonal Variation, Thousands
D: D=1 Automobile Industry Crisis Years, D=0 Automobile Industry Normal Years
Requirements: Use the data above and estimate alternate models in different functional forms (log-log, lin-lin, lin-log or log-lin). Check for normality assumption, individual and overall significance. Select best one (in your opinion) by using model selection criterias. Check the selected model for heteroscedasticy and autocorrelation assumptions. Interpret the coefficients of the selected model.
Data Set: New Passenger Cars Sold, United States YEAR Y X1 D 1971 10227 0 X2 X3 112 121,3 776,8 1972 10872 111 125,3 839,6 1973 11350 111,1 133,1 949,8 0 Y: Number of New Passenger Cars Sold (in thousands) 0 X1: Price Index of New Cars 1974 0 0 X2: Consumer Price Index All Items 0 X3: Personal Disposable Income, (in billions of $) 0 0 X4: Interest Rate (in percent) 0 X5: Employed Civilian Labor Force, Unadjusted for Seasonal Variation, Thousands 1980 0 D: D=1 Automobile Industry Crisis Years, D=0 Automobile Industry Normal Years 1981 8535 1982 7980 197,6 1983 9179 202,6 0 1984 1 Requirements: Use the data above and estimate alternate models in different functional forms (log-log, lin-lin, lin-log or log-lin). Check for normality assumption, individual and overall significance. Select best one (in your opinion) by using model selection criterias. Check the selected model for heteroscedasticy and autocorrelation assumptions. Interpret the coefficients of the selected model. X4 X5 4,89 79367 4,55 82153 7,38 85064 8775 117,5 147,7 1038,4 8,61 86794 1975 8539 127,6 161,2 1142,8 6,16 85846 1976 9994 135,7 170,5 1252,6 5,22 88752 1977 11046 142,9 181,5 1379,3 5,5 92017 1978 11164 153,8 195,3 1551,2 7,78 96048 1979 10559 166 217,7 1729,3 10,25 98824 8979 179,3 247 1918 11,28 99303 190,2 272,3 2127,6 100397 13,73 0 286,6 2261,4 11,2 99526 0 297,4 2428,1 8,69 100834 5394 208,5 307,6 2670,6 9,65 105005 1985 6039 215,2 318,5 2841,1 7,75 107150 1 1986 6450 224,4 323,4 3022,1 6,31 109597 1 1987 4388,5 209,22 299,53 2340,36 15,103 110436.7 1 1988 8778 217,36 315,26 2487.54 12,32 109478,6 0 1989 10096,9 222,86 327,14 2670,91 9,559 110917,4 0 1990 11433,4 229,35 338,36 2937,66 10,615 115505,5 0 1991 12142,9 236,72 350,35 3125,21 8,525 117865 0 1992 12595 246,84 355,74 3324,31 6,941 120556,7 0 1993 10242 228,24 326,76 2553,12 16,476 120476,4 0 1994 9576 237,12 343,92 2713,68 13,44 119431,2 0 1995 11014,8 243,12 356,88 2913,72 10,428 121000,8 0 1996 12472,8 250,2 369,12 3204,72 11,58 126006 0 1997 13246,8 258,24 382,2 3409,32 9,3 128580 0 1998 13740 269,28 388,08 3626,52 7,572 131516,4 0 1999 11095,5 247,26 353,99 2765,88 17,849 130516,1 2000 10374 256,88 372,58 2939,82 14,56 129383,8 0 2001 11932,7 263,38 386,62 3156,53 11,297 131084,2 0 2002 13512,2 271,05 399,88 3471,78 12,545 136506,5 0 2003 14350,7 279,76 414,05 3693,43 10,075 139295 0 2004 14885 291,72 420,42 3928,73 8,203 142476,1 0 0
Step by Step Solution
There are 3 Steps involved in it

Get step-by-step solutions from verified subject matter experts