

Question: Please, I want a correct and clear solution for all the paragraphs, written in clear handwriting as well. Please, expert, it is your duty. I
Please, I want a correct and clear solution for all the paragraphs, written in clear handwriting as well. Please, expert, it is your duty. I want to solve all the paragraphs correctly and beautifully. Please write the question number at the top of the page. Course name Biostatistics
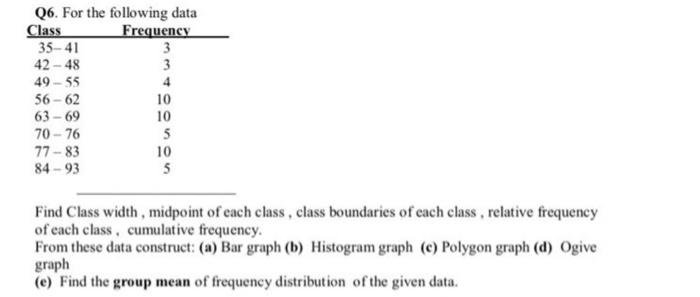
Find Class width, midpoint of each class, class boundaries of each class, relative frequency of each class, cumulative frequency. From these data construct: (a) Bar graph (b) Histogram graph (c) Polygon graph (d) Ogive graph (e) Find the group mean of frequency distribution of the given data
Step by Step Solution
There are 3 Steps involved in it
1 Expert Approved Answer
Step: 1 Unlock

Question Has Been Solved by an Expert!
Get step-by-step solutions from verified subject matter experts
Step: 2 Unlock
Step: 3 Unlock