

Question: please I want a good answer with a good expline Cash Flow Statement 1) The 2016 comparative income statement and the 2016 comparative balance sheet
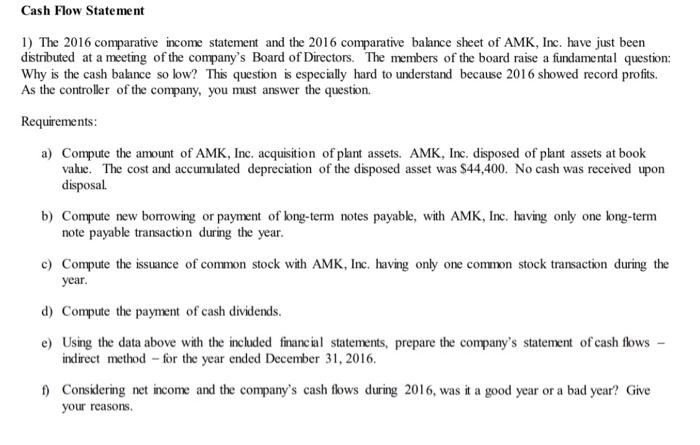
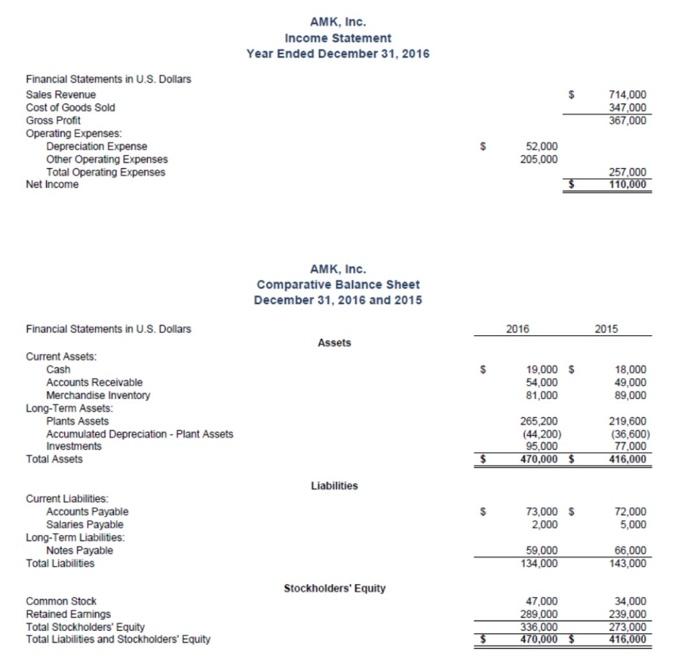
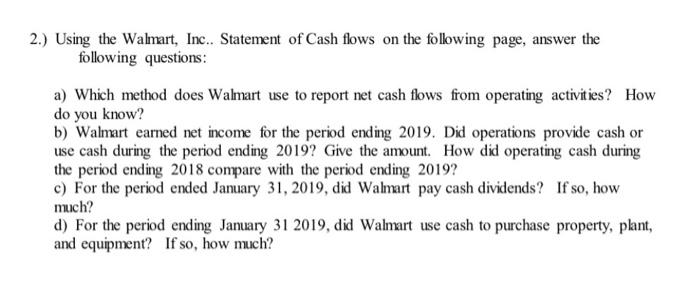
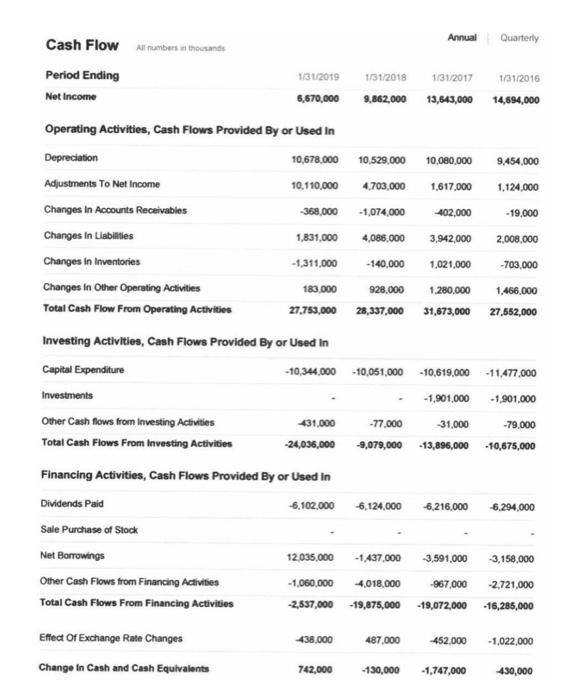
Cash Flow Statement 1) The 2016 comparative income statement and the 2016 comparative balance sheet of AMK, Inc. have just been distributed at a meeting of the company's Board of Directors. The members of the board raise a fundamental question: Why is the cash balance so low? This question is especially hard to understand because 2016 showed record profits. As the controller of the company, you must answer the question. Requirements: a) Compute the amount of AMK, Inc. acquisition of plant assets. AMK, Inc. disposed of plant assets at book value. The cost and accumulated depreciation of the disposed asset was $44,400. No cash was received upon disposal. b) Compute new borrowing or payment of long-term notes payable, with AMK, Inc. having only one long-term note payable transaction during the year. c) Compute the issuance of common stock with AMK, Inc. having only one common stock transaction during the year. d) Compute the payment of cash dividends. e) Using the data above with the included financial statements, prepare the company's statement of cash flows indirect method - for the year ended December 31, 2016. 1) Considering net income and the company's cash flows during 2016, was it a good year or a bad year? Give your reasons AMK, Inc. Income Statement Year Ended December 31, 2016 $ 714,000 347.000 367,000 Financial Statements in US Dollars Sales Revenue Cost of Goods Sold Gross Profit Operating Expenses Depreciation Expense Other Operating Expenses Total Operating Expenses Net Income 52,000 205,000 257,000 110,000 AMK, Inc. Comparative Balance Sheet December 31, 2016 and 2015 2016 2015 Assets Financial Statements in U.S. Dollars Current Assets: Cash Accounts Receivable Merchandise Inventory Long-Term Assets: Plants Assets Accumulated Depreciation - Plant Assets Investments Total Assets 19,000 $ 54,000 81,000 18,000 49,000 89,000 265,200 (44,200) 95.000 470,000 $ 219,600 (36,600) 77,000 416,000 $ Liabilities Current Liabilities: Accounts Payable Salaries Payable Long-Term Liabilities: Notes Payable Total Liabilities 72,000 5,000 73,000 $ 2,000 59.000 134.000 66,000 143,000 Stockholders' Equity Common Stock Retained Eamings Total Stockholders' Equity Total Liabilities and Stockholders' Equity 47,000 289,000 336,000 470,000 $ 34,000 239.000 273,000 416.000 3 2.) Using the Walmart, Inc.. Statement of Cash flows on the following page, answer the following questions: a) Which method does Walmart use to report net cash flows from operating activities? How do you know? b) Walmart earned net income for the period ending 2019. Did operations provide cash or use cash during the period ending 2019? Give the amount. How did operating cash during the period ending 2018 compare with the period ending 2019? c) For the period ended January 31, 2019, did Walmart pay cash dividends? If so, how much? d) For the period ending January 31 2019, did Walmart use cash to purchase property, plant, and equipment? If so, how much? Annual 402,000 Quarterly Cash Flow All rumbers in thousands Period Ending 1312019 1/31/2018 1/31/2017 1/31/2016 Net Income 6,670,000 9,862,000 13,643,000 14,694,000 Operating Activities, Cash Flows Provided By or Used In Depreciation 10,678,000 10,529,000 10,080.000 9.454,000 Adjustments To Net Income 10.110,000 4,703,000 1,617,000 1,124,000 Changes in Accounts Receivables -368,000 - 1,074,000 - 19.000 Changes in Liabilities 1,831,000 4,085,000 3,942,000 2,008,000 Changes in Inventories -1.311.000 -140,000 1,021,000 -703,000 Changes in Other Operating Activities 183,000 928,000 1.280,000 1,466.000 Total Cash Flow From Operating Activities 27,753,000 28,337,000 31,673,000 27,662,000 Investing Activities, Cash Flows Provided By or Used In Capital Expenditure -10.344,000 -10,051,000 -10,619,000 -11,477,000 Investments -1,901,000 -1,901,000 Other Cash flows from Investing Activities 431,000 -77.000 31,000 Total Cash Flows From Investing Activities -24,036,000 -9,079,000 -13,896,000 -10,675,000 Financing Activities, Cash Flows Provided By or Used In Dividends Paid 6.102.000 -6,124,000 6.216,000 6,294,000 Sale Purchase of Stock Net Borrowings 12.035,000 1,437,000 -3,591,000 3,158,000 Other Cash Flows from Financing Adivities -1,060,000 4,018,000 967,000 -2.721.000 Total Cash Flows From Financing Activities -2,537,000 -19,875,000 - 19,072,000 -16,285,000 -79,000 Effect Of Exchange Rate Changes 438,000 487.000 452.000 -1,022,000 Change in Cash and Cash Equivalents 742,000 -130,000 -1.747,000 430,000
Step by Step Solution
There are 3 Steps involved in it

Get step-by-step solutions from verified subject matter experts