

Question: Please, I want a solution with a clear line Scatter diagram. Example : The local ice cream shop keeps track of how much ice cream
Please, I want a solution with a clear line
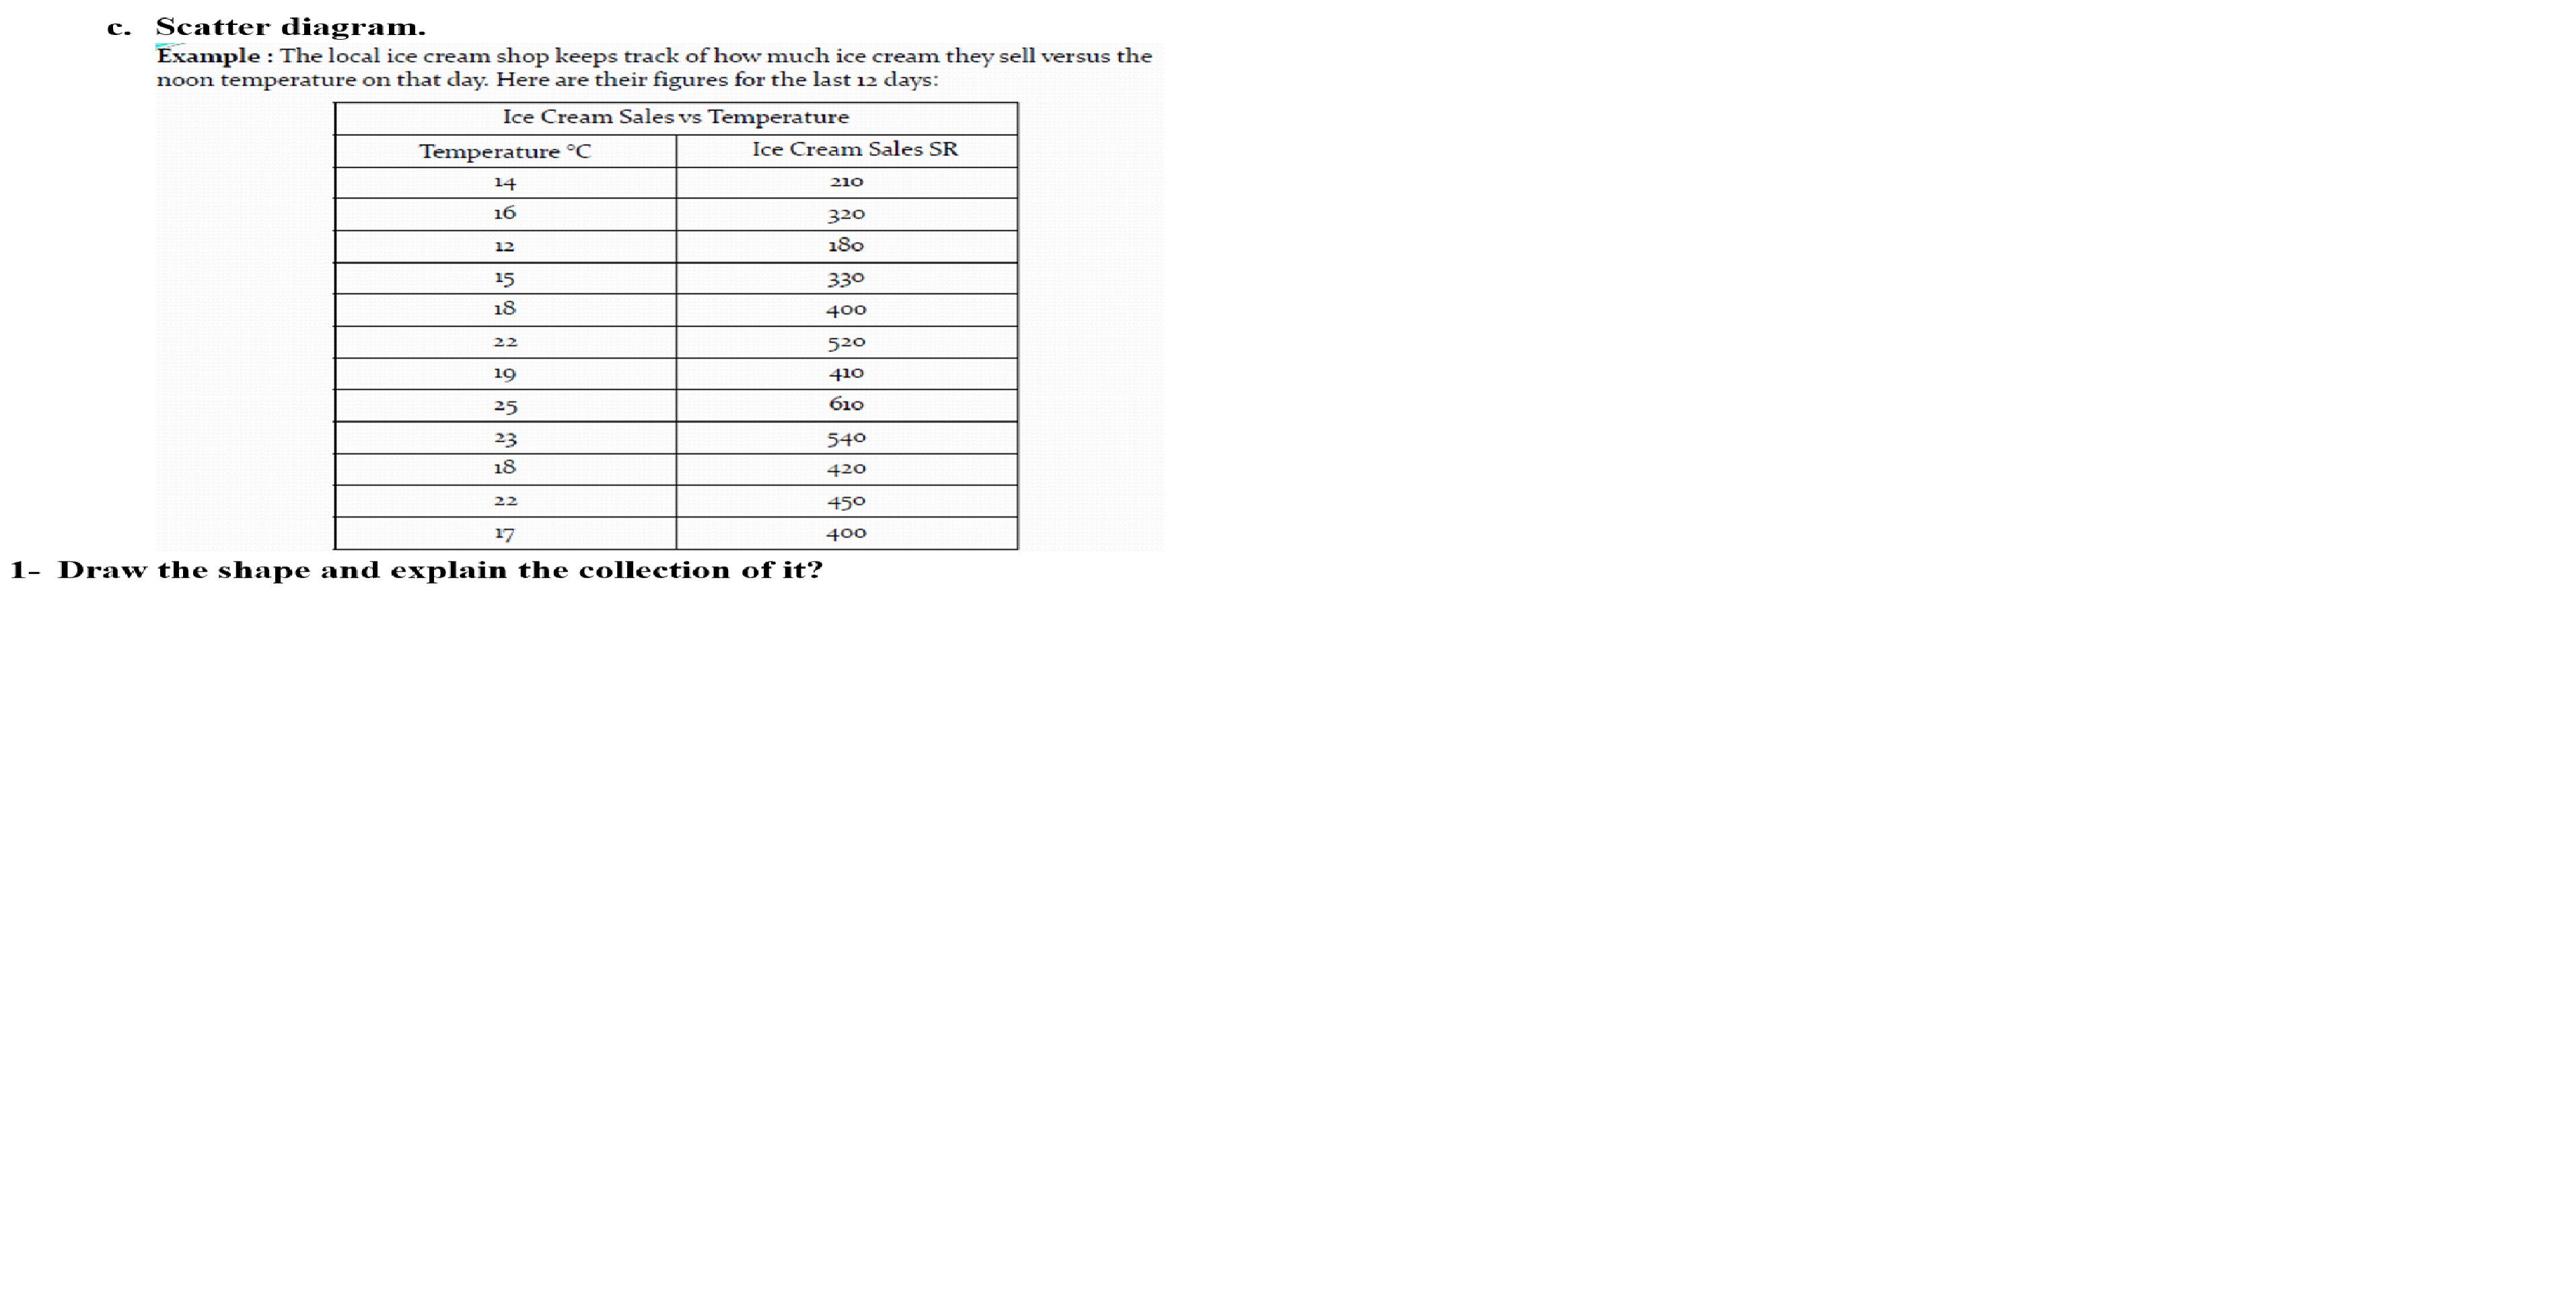
Scatter diagram. Example : The local ice cream shop keeps track of how much ice cream they sell versus the noon temperature on that day. Here are their figures for the last 12 days: Ice Cream Sales vs Temperature Temperature C Ice Cream Sales SR 14 210 16 320 12 180 15 330 18 400 22 520 19 410 25 610 Ez 18 540 420 22 450 17 400 1- Draw the shape and explain the collection of it
Step by Step Solution
There are 3 Steps involved in it
1 Expert Approved Answer
Step: 1 Unlock

Question Has Been Solved by an Expert!
Get step-by-step solutions from verified subject matter experts
Step: 2 Unlock
Step: 3 Unlock