

Question: Please I will ask b in the comments, thanks The following table shows the hot dogs bought from a street vendor over the course of

Please I will ask b in the comments, thanks
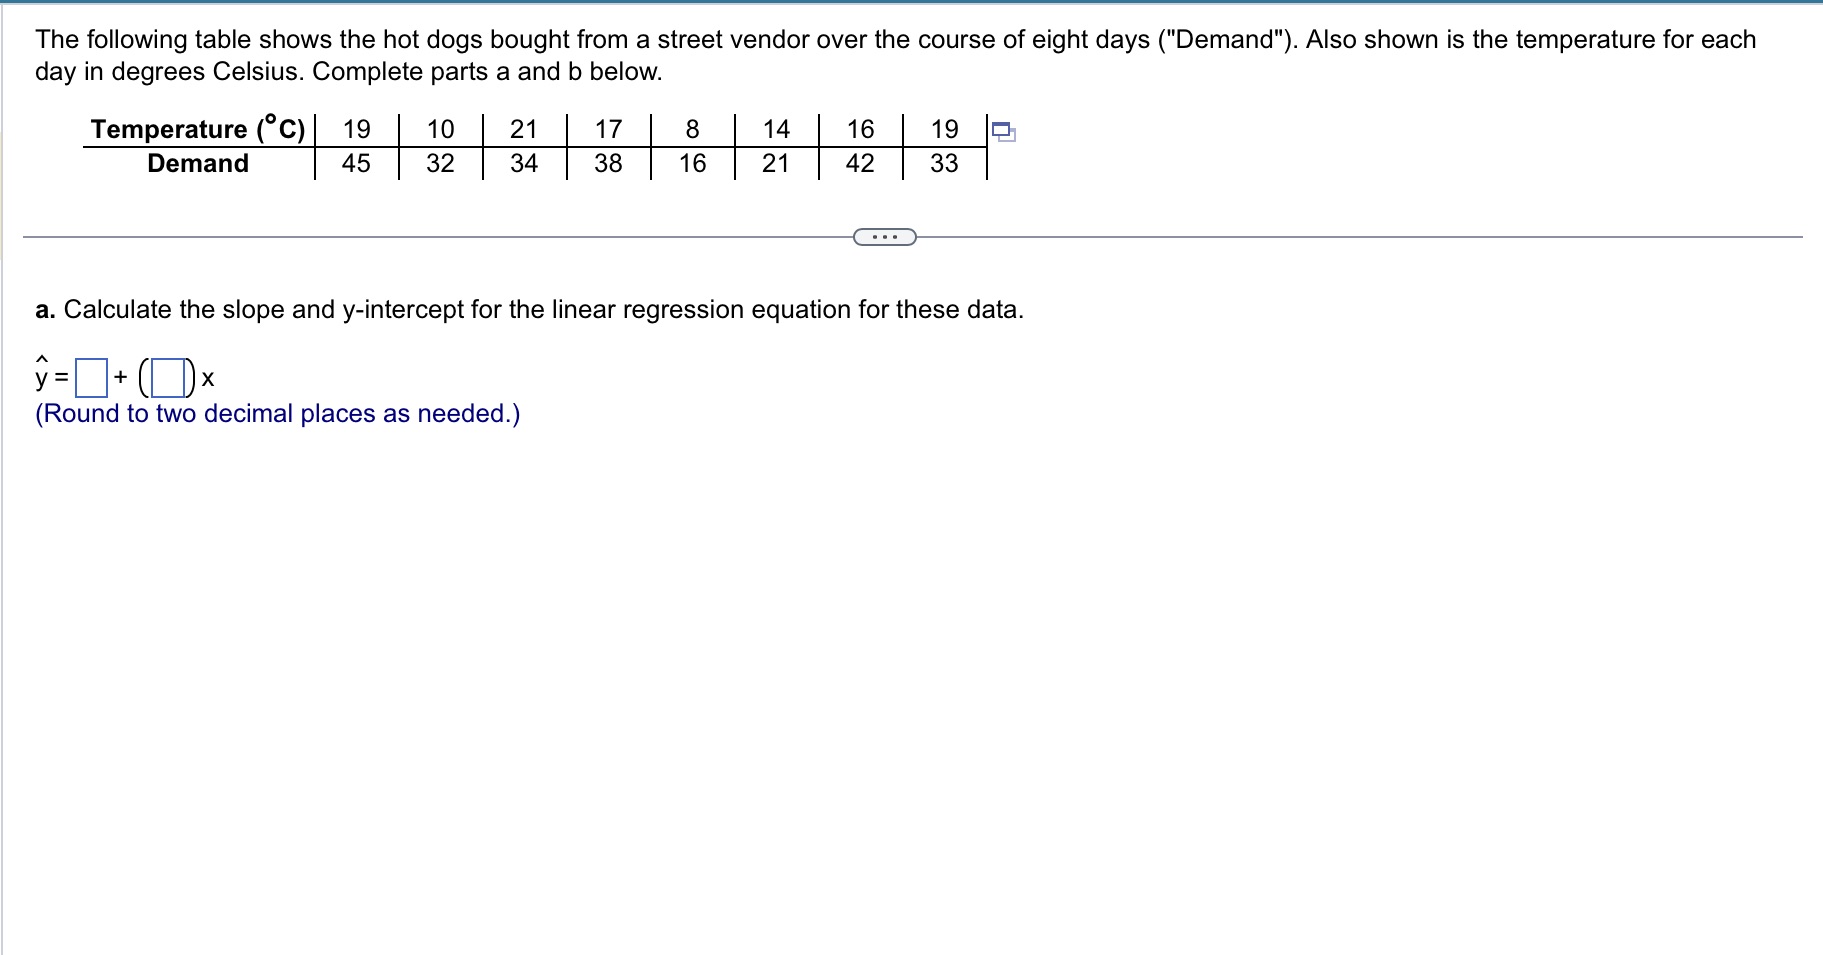
The following table shows the hot dogs bought from a street vendor over the course of eight days ("Demand"). Also shown is the temperature for each day in degrees Celsius. Complete parts a and b below. Temperature(C) 19 1o 21 17 8 14 16 19 g Demand 45 32 34 38 1s 21 42 33 3. Calculate the slope and y-intercept for the linear regression equation for these data. =D+(D)x (Round to two decimal places as needed.)
Step by Step Solution
There are 3 Steps involved in it
1 Expert Approved Answer
Step: 1 Unlock

Question Has Been Solved by an Expert!
Get step-by-step solutions from verified subject matter experts
Step: 2 Unlock
Step: 3 Unlock