

Question: Please, if possible, give whole answer with graph. I need to make sure the question is correct. 1. A professor of economics wants to study
Please, if possible, give whole answer with graph. I need to make sure the question is correct.
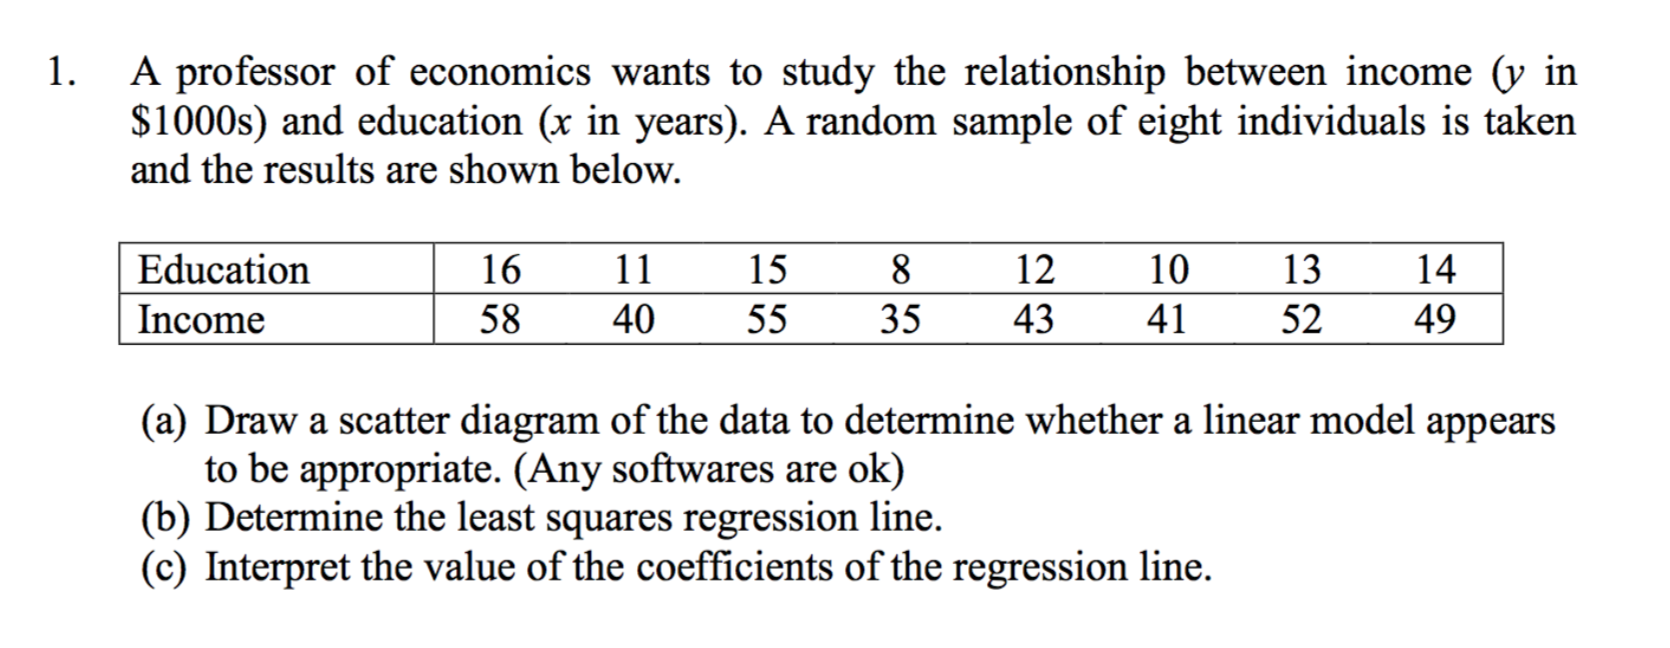
1. A professor of economics wants to study the relationship between income (y in $10005) and education (x in years). A random sample of eight individuals is taken and the results are shown below. 16 11 15 8 12 10 13 14 58 40 55 35 43 41 52 49 (a) Draw a scatter diagram of the data to determine whether a linear model appears to be appropriate. (Any sowares are ok) (b) Determine the least squares regression line. (c) Interpret the value of the coefcients of the regression line
Step by Step Solution
There are 3 Steps involved in it
1 Expert Approved Answer
Step: 1 Unlock

Question Has Been Solved by an Expert!
Get step-by-step solutions from verified subject matter experts
Step: 2 Unlock
Step: 3 Unlock