

Question: please if you can do it in excel and take picture of it please help! MTH 154 Quantitative Reasoning Proje ct Comparing Supermarket Prices Supermarkets
please if you can do it in excel and take picture of it please help!
MTH
154
Quantitative Reasoning
Proje
ct Comparing Supermarket
Prices
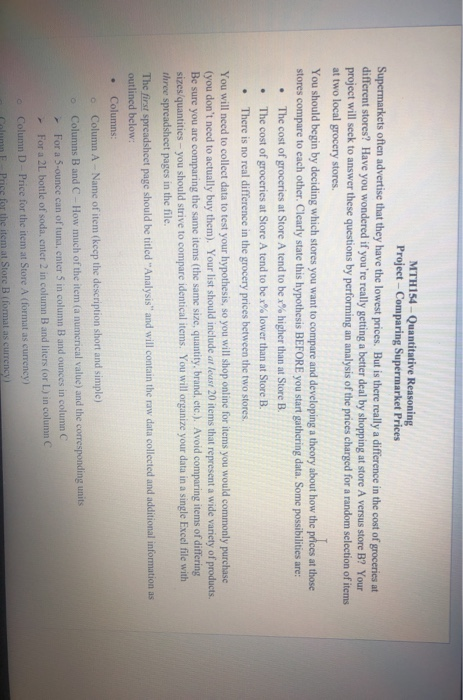
Supermarkets often advertise that they have the lowest prices. But is there really a difference in the cost of groceries at
different
stores? Have you wondered if youre really getting a better deal by shopping at store A versus store B? Your
project will seek to answer thes
e questions
by performing an analysis of the prices charged for a random selection of items
at two local grocery stores.
You should begin by deciding which stores you w
ant
to compare and
developing a theory about how the prices at th
ose
stores
compare to each other
. C
learly state this
hypothesis
BEFORE you start gathering data
. S
ome possibilities
are
:
The cost of groceries at Store A tend to be
x
%
higher than at Store B.
The cost of groceries at Store A tend to be
x
%
lower than at Store B.
There is no
real
difference in the
grocery prices between the two stores.
You will need to
collect data to test you
r hypothesis
, so
you will shop online for
items
you would commonly purchase
(you don
t need to actually buy the
m). Your
list
should include
at least
20
item
s that represent a wide variety of products
.
Be sure you
are comparing
the same items
( the same size, quantity, brand, etc.)
. Avoid comparing items of differing
sizes/quantities you should strive to compare identical items. You will organize your data in a
single
Excel file with
three
spreadsheet pages in the file.
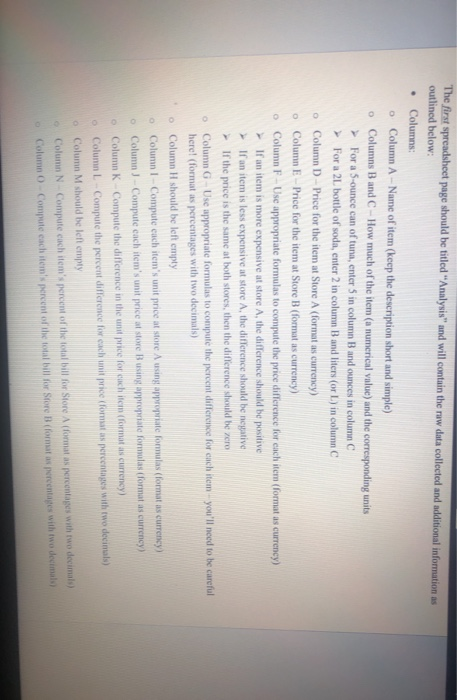
The
first
spreadsheet
page
should be titled
Analysis
and will contain the raw data collected and additional information as
outlined below
:
Columns:
o
Column A Name o
f item (keep the description short and simple)
o
Columns B and C How much of the item (a numerical value) and the corresponding units
For a 5
-ounce can of tuna, enter 5 in column B and ounces in column C
For a 2L bottle of soda, enter 2 in column B and liters (or L) in column C
o
Column D Price for the item at Store A (format as currency)
o
Column E Price for the item at Store B (format as currency)
o
Column F Use appropriate formulas to compute the price difference for each item (format as currency)
If an item is more expensive at store A, the difference should be positive
If an item is less expensive at store A, the d
ifference should be negative
If the price is the same at both stores, then the difference should be zero
o
Column G Use appropriate formulas to
compute the percent
difference
for each item
youll need to be careful
here! (format as pe
rcentages with two d
ecimal
s)
o
Column H should be left empty
o
Column I
Compute each items unit price at store A using appropriate formulas (format as currency)
o
Column J
Compute each items unit price at store B
using appropriate formulas (format as currency)
o
Column K
Comp
ute the difference in the unit price for each item (format as currency)
o
Column L
Compute the percent difference for each unit price (format as percentages with two decimal
s)
o
Column M should be left empty
o
Column N Compute each items percent of the
total bill for Store A (format as percentages with two decimals)
o
Column O Compute each items percent of the total bill for Store B (format as percentages with two decimals)
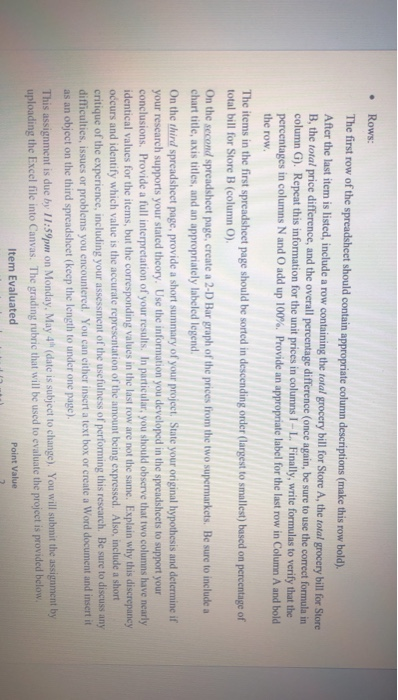
Rows:
The first row of the spreadsheet should contain appropriate column descrip
tions
(make this row bold).
After the last item is listed, include a row containing
the
total
grocery bill for S
tore
A, the
total
grocery bill for Store
B, the
total
price difference, and the overall percentage difference
(once again, be sure to use the co
rrect formula in
column G). Repeat this information for the unit prices in columns I L
. Finally,
write formulas to verify that the
percentages in columns N and O
add up
100%
. Provide an appropriate l
abel
for the last row
in Column A and bold
the row.
The items in the first spreadsheet
page
should be sorted in des
cending order (l
arg
est to
sma
llest) based on p
ercentage of
total bill for Store B (column O)
.
On th
e
second
spreadsheet
page
, create a
2- D Bar graph of the prices from the two supermarkets. Be sure to include a
chart title, axis titles, and a
n appropriately labeled legend.
On the
third
spreadsheet
page
, provide a short summary of your project. State your original hypothesis and determine if
your research supports your stated theory. Use the i
nformation you developed in the spreadsheets to support your
conclusions. Provide a full interpretation of your results. In particular, y
ou should observe that two columns have nearly
identical values for the items, but the corresponding values in the last row are not the same. Explain why this discrepancy
occurs and identify which value is the accurate representation of the amount being expressed. Also, include a short
critique of the experience, including your assessment of the usefulness of performin
g this research. Be sure to
discuss any
difficulties, i
ssues or problems you
encountered. You can eit
her insert a text box or
create a Word document and insert it
as an object on the third spreadsheet (keep the length to under one page).
MTH154 - Quantitative Reasoning Project - Comparing Supermarket Prices Supermarkets often advertise that they have the lowest prices. But is there really a difference in the cost of groceries at different stores? Have you wondered if you're really getting a better deal by shopping at store A versus store B? Your project will seek to answer these questions by performing an analysis of the prices charged for a random selection of items at two local grocery stores. You should begin by deciding which stores you want to compare and developing a theory about how the prices at those stores compare to each other. Clearly state this hypothesis BEFORE you start gathering data. Some possibilities are: The cost of groceries at Store A tend to be x% higher than at Store B. The cost of groceries at Store A tend to be x% lower than at Store B. . There is no real difference in the grocery prices between the two stores. You will need to collect data to test your hypothesis, so you will shop online for items you would commonly purchase (you don't need to actually buy them). Your list should include at least 20 items that represent a wide variety of products. Be sure you are comparing the same items (the same size, quantity, brand, etc.). Avoid comparing items of differing sizes quantities - you should strive to compare identical items. You will organize your data in a single Excel file with three spreadsheet pages in the file. The first spreadsheet page should be titled "Analysis" and will contain the raw data collected and additional information as outlined below: Columns Column A -Name of item (keep the description short and simple) o Columns B and C - How much of the item (a numerical value) and the corresponding units For a 5-ounce can of tuna, enter 5 in column B and ounces in column For a 2L bottle of soda, enter 2 in column B and liters for L) in column C Column D - Price for the item at Store A (format as currency) Column Price for the item at Store B (formal as currency The first spreadsheet page should be titled "Analysis and will contain the ruw data collected and additional information outlined below: Columns O Column A -Name of item (keep the description short and simple) Columns B and C - How much of the item (a numerical value) and the corresponding units For a 5-ounce can of tuna, enter 5 in column B and ounces in column C For a 2L bottle of soda, enter 2 in column B and liters (or L) in column C Column D-Price for the item at Store A (format is currency) Column E-Price for the item at Store B (format is currency) Column F - Use appropriate formulas to compute the price difference for each item (format as currency) If an item is more expensive at store A, the difference should be positive If an item is less expensive at store A, the difference should be negative If the price is the same at both stores, then the difference should be zero o Column G Use appropriate formulas to compute the percent difference for each item you'll need to be careful herel (format as percentages with two decimals) Column H should be left empty Column 1 Compute each item's unit price at store using appropriate formulas (format is currency Column - Compute each item's unit price at store using appropriate formulas format as currency) Column K Compute the difference in the unit price for each item formats currency) Column L Compute the percent difference for each unit price for atas percentages with two decimals) Column M should be left empty Column N Compute cach item's percent of the total bill for Store A (format as percentages with two decimals) percentages with two decimals Column Compute each item's percent of the total bill for Store B (format Rows: The first row of the spreadsheet should contain appropriate column descriptions (make this row bold). After the last item is listed, include a row containing the total grocery bill for Store A, the total grocery bill for Store B, the total price difference, and the overall percentage difference once again, be sure to use the correct formula in column G). Repeat this information for the unit prices in columns 1 - L. Finally, write formulas to verify that the percentages in columns N and O add up 100%. Provide an appropriate label for the last row in Column A and bold the row. The items in the first spreadsheet page should be sorted in descending order (largest to smallest) based on percentage of total bill for Store B (column O). On the second spreadsheet page, create a 2-D Bar graph of the prices from the two supermarkets. Be sure to include a chart title, axis titles, and an appropriately labeled legend On the third spreadsheet page, provide a short summary of your project. State your original hypothesis and determine if your research supports your stated theory. Use the information you developed in the spreadsheets to support your conclusions. Provide a full interpretation of your results. In particular, you should observe that two columns have nearly identical values for the items, but the corresponding values in the last row are not the same. Explain why this discrepancy occurs and identify which value is the accurate representation of the amount being expressed. Also include a short critique of the experience, including your assessment of the usefulness of performing this research. Be sure to discuss any difficulties, issues or problems you encountered. You can either insert a text box or create a Word document and insert it as an object on the third spreadsheet (keep the length to under one page). This assignment is due by 11:59pm on Monday, May 4" (date is subject to change). You will submit the assignment by uploading the Excel file into Canvas. The grading rubric that will be used to evaluate the project is provided below. Item Evaluated Point Value MTH154 - Quantitative Reasoning Project - Comparing Supermarket Prices Supermarkets often advertise that they have the lowest prices. But is there really a difference in the cost of groceries at different stores? Have you wondered if you're really getting a better deal by shopping at store A versus store B? Your project will seek to answer these questions by performing an analysis of the prices charged for a random selection of items at two local grocery stores. You should begin by deciding which stores you want to compare and developing a theory about how the prices at those stores compare to each other. Clearly state this hypothesis BEFORE you start gathering data. Some possibilities are: The cost of groceries at Store A tend to be x% higher than at Store B. The cost of groceries at Store A tend to be x% lower than at Store B. . There is no real difference in the grocery prices between the two stores. You will need to collect data to test your hypothesis, so you will shop online for items you would commonly purchase (you don't need to actually buy them). Your list should include at least 20 items that represent a wide variety of products. Be sure you are comparing the same items (the same size, quantity, brand, etc.). Avoid comparing items of differing sizes quantities - you should strive to compare identical items. You will organize your data in a single Excel file with three spreadsheet pages in the file. The first spreadsheet page should be titled "Analysis" and will contain the raw data collected and additional information as outlined below: Columns Column A -Name of item (keep the description short and simple) o Columns B and C - How much of the item (a numerical value) and the corresponding units For a 5-ounce can of tuna, enter 5 in column B and ounces in column For a 2L bottle of soda, enter 2 in column B and liters for L) in column C Column D - Price for the item at Store A (format as currency) Column Price for the item at Store B (formal as currency The first spreadsheet page should be titled "Analysis and will contain the ruw data collected and additional information outlined below: Columns O Column A -Name of item (keep the description short and simple) Columns B and C - How much of the item (a numerical value) and the corresponding units For a 5-ounce can of tuna, enter 5 in column B and ounces in column C For a 2L bottle of soda, enter 2 in column B and liters (or L) in column C Column D-Price for the item at Store A (format is currency) Column E-Price for the item at Store B (format is currency) Column F - Use appropriate formulas to compute the price difference for each item (format as currency) If an item is more expensive at store A, the difference should be positive If an item is less expensive at store A, the difference should be negative If the price is the same at both stores, then the difference should be zero o Column G Use appropriate formulas to compute the percent difference for each item you'll need to be careful herel (format as percentages with two decimals) Column H should be left empty Column 1 Compute each item's unit price at store using appropriate formulas (format is currency Column - Compute each item's unit price at store using appropriate formulas format as currency) Column K Compute the difference in the unit price for each item formats currency) Column L Compute the percent difference for each unit price for atas percentages with two decimals) Column M should be left empty Column N Compute cach item's percent of the total bill for Store A (format as percentages with two decimals) percentages with two decimals Column Compute each item's percent of the total bill for Store B (format Rows: The first row of the spreadsheet should contain appropriate column descriptions (make this row bold). After the last item is listed, include a row containing the total grocery bill for Store A, the total grocery bill for Store B, the total price difference, and the overall percentage difference once again, be sure to use the correct formula in column G). Repeat this information for the unit prices in columns 1 - L. Finally, write formulas to verify that the percentages in columns N and O add up 100%. Provide an appropriate label for the last row in Column A and bold the row. The items in the first spreadsheet page should be sorted in descending order (largest to smallest) based on percentage of total bill for Store B (column O). On the second spreadsheet page, create a 2-D Bar graph of the prices from the two supermarkets. Be sure to include a chart title, axis titles, and an appropriately labeled legend On the third spreadsheet page, provide a short summary of your project. State your original hypothesis and determine if your research supports your stated theory. Use the information you developed in the spreadsheets to support your conclusions. Provide a full interpretation of your results. In particular, you should observe that two columns have nearly identical values for the items, but the corresponding values in the last row are not the same. Explain why this discrepancy occurs and identify which value is the accurate representation of the amount being expressed. Also include a short critique of the experience, including your assessment of the usefulness of performing this research. Be sure to discuss any difficulties, issues or problems you encountered. You can either insert a text box or create a Word document and insert it as an object on the third spreadsheet (keep the length to under one page). This assignment is due by 11:59pm on Monday, May 4" (date is subject to change). You will submit the assignment by uploading the Excel file into Canvas. The grading rubric that will be used to evaluate the project is provided below. Item Evaluated Point Value
Step by Step Solution
There are 3 Steps involved in it

Get step-by-step solutions from verified subject matter experts