

Question: (((please if you do not Know the right answer do not solve the problem)))Iam looking for somone professional,please do not copy the old answer it
(((please if you do not Know the right answer do not solve the problem)))Iam looking for somone professional,please do not copy the old answer it is not same , NO write by Hand. I need to solution this problem by Microsoft Project software for solution to this problem.)))))
the question is
Consider the following project. Use activity times as the most likely time for determining the critical path. Use the optimistic and pessimistic times (together with activity times) to determine expected completion time limits
- Draw PERT Chart with earliest and latest start and finish times/activity. Fill in the slack time in the table for each activity. Show the slack time for each path for all paths and show Critical Path (CPM) and CPM time.
- What is the expected time for 68, 95 and 99 percent Confidence Interval (CI) for the project?
Show the (ID 0=55%, ID1=60%, ID 2=70%, ID 3=80%, ID 4=85%, ID 5=50%, ID 6=65%, ID 7=75%, 8=99.5%, ID 9=97.5%),
Please note This problem contains two Dummy activities.
- You can use Microsoft Project software for solution to this problem, but please show dummy activities in your solution.
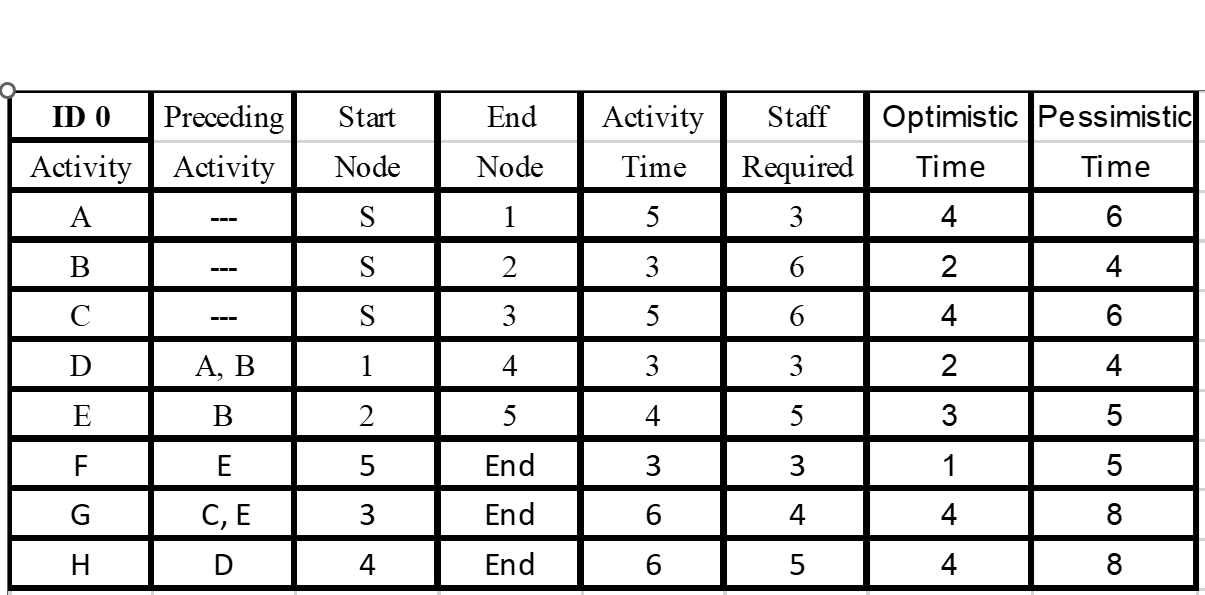
\begin{tabular}{|c|c|c|c|c|c|c|c|} \hline ID 0 & Preceding & Start & End & Activity & Staff & Optimistic & Pessimistic \\ \hline Activity & Activity & Node & Node & Time & Required & Time & Time \\ \hline A & & S & 1 & 5 & 3 & 4 & 6 \\ \hline B & & S & 2 & 3 & 6 & 2 & 4 \\ \hline C & & S & 3 & 5 & 6 & 4 & 6 \\ \hline D & A,B & 1 & 4 & 3 & 3 & 2 & 4 \\ \hline E & B & 2 & 5 & 4 & 5 & 3 & 5 \\ \hline F & E & 5 & End & 3 & 3 & 1 & 5 \\ \hline G & C,E & 3 & End & 6 & 4 & 4 & 8 \\ \hline H & D & 4 & End & 6 & 5 & 4 & 8 \\ \hline \end{tabular}
Step by Step Solution
There are 3 Steps involved in it

Get step-by-step solutions from verified subject matter experts