

Question: PLEASE IGNORE THIS QUESTION. IT NO LONGER NEEDS TO BE ANSWERED. CHEGG DOES NOT ALLOW DELETION OF QUESTIONS. THANK YOU. Please provide downloadable excel sheet
PLEASE IGNORE THIS QUESTION. IT NO LONGER NEEDS TO BE ANSWERED. CHEGG DOES NOT ALLOW DELETION OF QUESTIONS. THANK YOU.
Please provide downloadable excel sheet and graphs, not pictures. Do not bother to answer if no excel sheets. I cannot learn to solve these problems if I cannot view the formula used to solve them. Must provide excel sheet and curve in downloadable format that allows for viewing complete work. NO PICTURES.
Return data for mutual fund XYZ, the S&P 500, and 90-day T-Bills can be found in the attached Excel file
a) Plot the risk premium of Fund XYZ vs. the market premium (10 pts)
b) What is Fund XYZ's beta? Hint: use the "slope function" in Excel. (5 pts)
c) What is Fund XYZ's alpha? Hint: use the "intercept function" in Excel. (5 pts)
Upload the completed Excel file below.
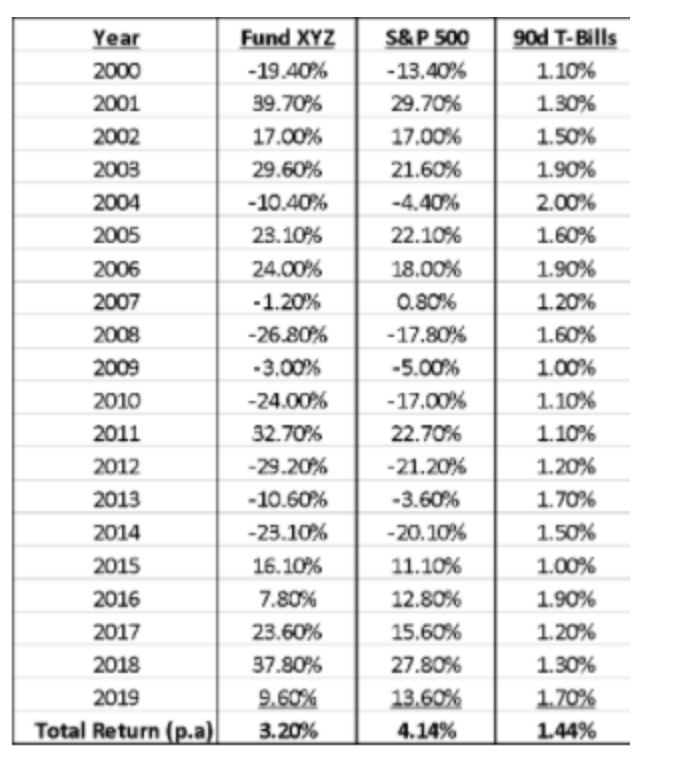
Year 2000 2001 2002 2003 2004 2005 2006 2007 2008 2009 2010 2011 2012 2013 2014 2015 2016 2017 2018 2019 Total Return (p.a) Fund XYZ - 19.40% 39.70% 17.00% 29.60% -10.40% 23.10% 24.00% -1.20% -26.80% -3.00% -24.00% 32.70 -29.20% - 10.60% -23.10% 16.10% 7.80% 23.60% 37.80% 9.60% 3.20% S&P 500 - 13.40% 29.70% 17.00% 21.60% -4.40% 22.10% 18.00% 0.80% - 17.80% -5.00% - 17.00% 22.70% -21.20% -3.60% -20.10% 11.10% 12.80% 15.60% 27.80% 13.60% 4.14% 90d T-Bills 1.10% 1.30% 1.50% 1.90% 2.00% 1.60% 1.90% 1.20% 1.60% 1.00% 1.10% 1.10% 1.20% 1.70% 1.50% 1.00% 1.90% 1.20% 1.30% 1.70% 1.44%
Step by Step Solution
There are 3 Steps involved in it

Get step-by-step solutions from verified subject matter experts