

Question: please Illustrate a graph clearly labeled with letters, and please do it on paper Oil is initially sold in an open, perfectly competitive market. Domestic
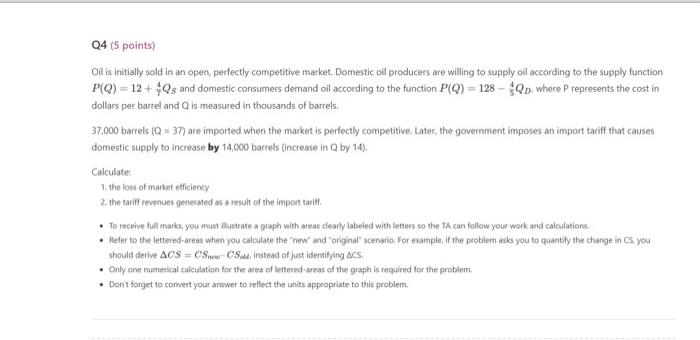
Oil is initially sold in an open, perfectly competitive market. Domestic oll producers are willing to supply oil according to the supply function P(Q)=12+74QS and domestic consumers demand oil according to the function P(Q)=12854QD. where P represents the cost in dollars per barrel and Q is measured in thousands of barrels. 37,000 barrels (Q=37) are imported when the market is perfectly competitive. Latet, the government imposes an import tariff that causes domestic supply to increase by 14,000 barrels (increase in Q by 14). Calculate: 1. the low of market efficiency 2. the tariff revenues generated as o result of the import tariff. - To receive full marks, you must illustrate a graph with areas dearty labeled with letters so the Th can follow your work and calculations. - Fefer to the lettered-areas when you calculate the "new' and "original" scenaria, For example, if the probiem asks you to quantify the change in cS, you - Only one numerical calculation for the ares of lettered-areas of the graph is requited for the problem. - Donit forget to conwert your anower to reflect the units appropriate to this
Step by Step Solution
There are 3 Steps involved in it

Get step-by-step solutions from verified subject matter experts