

Question: Please include a screenshot of the code and an example of the outcome 39. Supply and Demand Each year's level of production and price (per
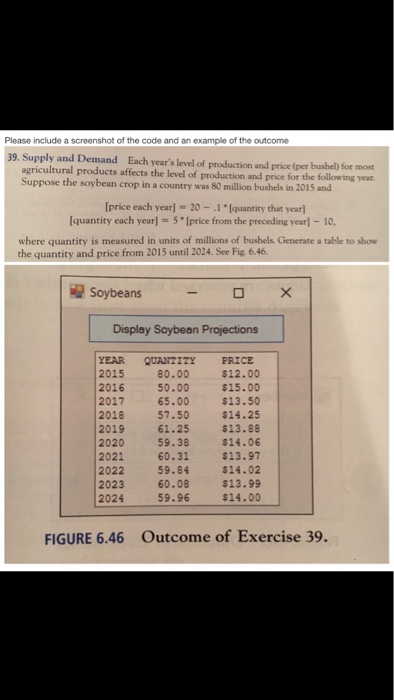
Please include a screenshot of the code and an example of the outcome 39. Supply and Demand Each year's level of production and price (per bushel) for most agricultural products affects the level of production and price for the following yeat. Suppose the soybean crop in a country was 80 million bushels in 2015 and Iprice each year] 20-1* (quantity that yearl quantity each year] 5* (price from the preceding year] 10, where quantity is measured in units of millions of bushels. Generate a table to show the quantity and price from 2015 until 2024. See Fig, 6.46. Soybeans x Display Soybean Projections YEAR QUANTITY RICE 2015 80.00 2016 50.00 2017 2018 2019 $12.00 $15.00 $13.50 57.50 $14.25 $13.88 2020 59.38 $14.06 2021 60.31 $13.97 $14.02 $13.99 $14.00 65.00 61.25 2022 2023 2024 59.84 60.08 59.96 FIGURE 6.46 Outcome of Exercise 39
Step by Step Solution
There are 3 Steps involved in it

Get step-by-step solutions from verified subject matter experts