

Question: PLEASE INCLUDE ALL FORMULAS, CONSTRAINTS AND SOLVER SCREENSHOTS! THANK YOU SO MUCH! Problem Statement Suppose that you begin planning your investments on your 40 birthday
PLEASE INCLUDE ALL FORMULAS, CONSTRAINTS AND SOLVER SCREENSHOTS! THANK YOU SO MUCH!
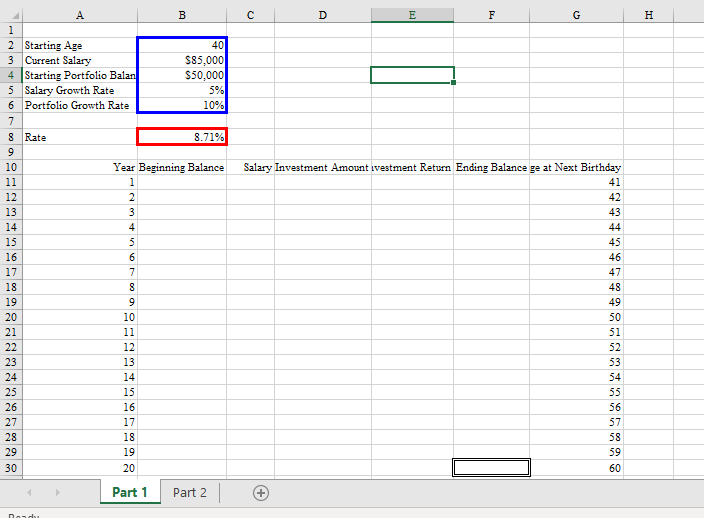
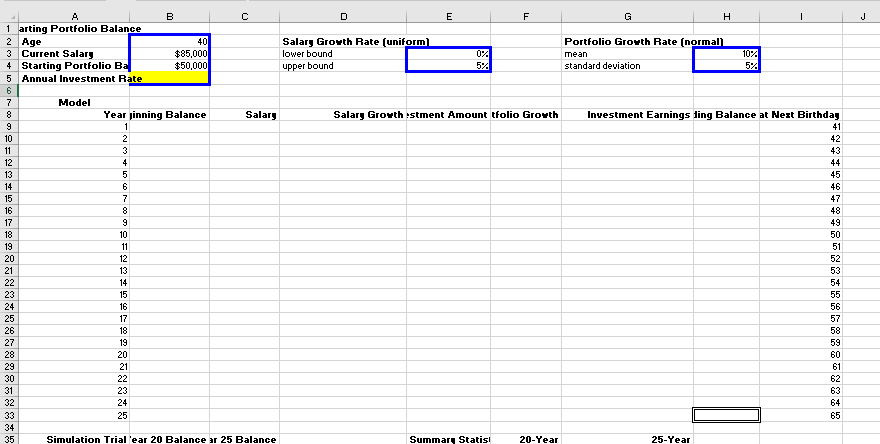
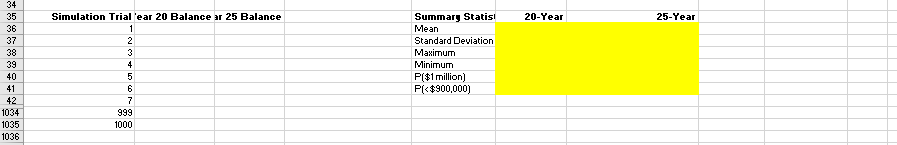
Problem Statement Suppose that you begin planning your investments on your 40 birthday (the sooner you start, the better!), retire at the age of 65, and expect some amount of growth in your salary year to year. Further suppose that you intend to invest some consistent proportion of your income each year and wish to understand the final value of your retirement account based on what proportion of your income you invest each year. Finally, to make the math easier, let's assume that you deposit each year's investment all at once at the beginning of the year. NOTE: Like the demonstration video from this Module, you can tweak and reuse this template for your own personal planning :) Part 1 Suppose you've set a goal of having a million dollars in your retirement portfolio by the age of 60; begin by developing a what-if model using the template provided to represent the problem above ie to assess what balance you can expect at the age of 60. To make the math easy, assume for the moment that both your salary growth and your portfolio's return on investment will be consistent each year. To validate your model, enter an Annual Investment Rate of 7.5%; if you have built the model correctly, you should find a Total Profit of $907,782. Once you've confirmed that you what-if model is correct, use Goal Seek to determine the minimum Annual Investment Rate necessary to have a balance of at least $1,000,000 when you turn 60. Part 25/ Now turn to the Part 2 worksheet where we will expand on the ideas of Part 1. First, copy the investment return rate you found through Goal Seek in Part 1, then paste-values-only (found in the right-click menu) into the according Annual Investment Rate (cell B5) on the Part 2 worksheet. Next, use the techniques of Monte Carlo simulation to simulate your Salary Growth and Investment Earnings for each year in columns D and G. Then, adapt the formulas you developed in Part I to this version of the problem. If done correctly, you should be able to copy- and-paste or Fill the formulas from the second row of the table (row 10) all the way down through year 25. Be careful when you fill the formulas though, and either paste-formulas-only in the right-click menu or Fill Without Formatting so that you do not overwrite the double border and bold in cell H33. Given that this problem is highly uncertain, I cannot give you a reliable number for validation, but the 25-year balance should likely be somewhere around 1.5 million. To see if your spreadsheet is producing this result, repeatedly click Calculate Now under the Formulas tab and see if the values seem to center around a million and a half. Obviously, a more scientific approach than the "eyeballing it would be preferable, which we can achieve through a Data Table. The table has been mostly prepared for you, and just needs relative references (don't hard code!) in cells B36 and B37 to bring in the predicted balance in Year 20 and 25 respectively. After those formulas are referenced, create the Data Table to include all 1000 Simulation Trials. To facilitate this, Trials 8 through 998 are hidden. After completing the Data Table, complete the yellow-highlighted cells to provide summary statistics for all 1000 replications of both key years in the Data Table. For validation, your 20- Year Mean should be around $860k-$875k, and again the 25-Year Mean should be around $1.47 million to $1.50 million Once both Parts 1 and 2 are completed, save and upload your completed Template to the Module 14 Monte Carlo Simulation Homework folder. D A E F G H A B 1 2 Starting Age 40 3 Current Salary $85,000 4 Starting Portfolio Balan $50,000 5 Salary Growth Rate 5% 6 Portfolio Growth Rate 10% 7 8 Rate 8.71% 9 10 Year Beginning Balance 11 1 12 2 13 3 14 4 15 5 16 6 17 7 18 8 19 9 20 10 21 11 22 12 23 13 24 14 25 15 26 16 27 17 28 18 29 19 30 20 Jan DCO Salary Investment Amount ivestment Return Ending Balance ge at Next Birthday 41 42 43 44 45 46 47 48 49 50 51 52 53 54 55 56 57 58 59 60 Part 1 Part 2 Nandur B c J D E F G H 1 1 arting Portfolio Balance 2 Age 40 Salary Growth Rate (uniform Portfolio Growth Rate (normal) $85,000 3 Current Salary lower bound 02 mean 10% 4 Starting Portfolio Ba $50,000 upper bound 5% standard deviation 5% 5 Annual Investment Rate 6 7 Model 8 Year jinning Balance Salary Salary Growth stment Amount tfolio Growth Investment Earnings ding Balance at Next Birthday 9 1 41 10 2 42 11 3 43 12 4 44 13 5 45 14 6 46 15 7 47 16 8 48 17 9 49 18 10 50 19 11 51 20 12 52 21 13 53 22 14 54 23 15 55 24 16 56 25 17 57 26 18 58 27 19 59 28 20 60 29 21 61 30 22 62 31 23 63 32 24 64 33 25 65 34 35 Simulation Trial 'ear 20 Balance ar 25 Balance Summary Statis! 20-Year 25-Year 20-Year 25-Year 34 35 36 37 38 39 40 41 42 1034 Simulation Trial 'ear 20 Balance ar 25 Balance 1 2 3 4 5 6 7 999 1000 Summary Statisi Mean Standard Deviation Maximum Minimum P($1 million) P[
Step by Step Solution
There are 3 Steps involved in it

Get step-by-step solutions from verified subject matter experts