Question: Please include all formulas on excel and answer each question detailed. Will rate. Question Set 1. You are an inventory management consultant. You have been

Please include all formulas on excel and answer each question detailed. Will rate. Please include all formulas on excel and answer
Question Set 1. You are an inventory management consultant. You have been hired by Costco to help optimize inventory management for their Poultry department. Your immediate task is building a Monte Carlo simulation for sales of Eggs, Chicken and Turkey. The probabilities of monthly demand levels are: Probability 0.05 0.10 0.15 0.05 0.15 0.10 0.15 0.10 0.10 0.05 Eggs 174 210 234 250 268 290 308 324 348 384 Chicken 258 289 302 320 342 366 388 400 421 454 Turkey 288 308 320 340 352 366 382 403 440 480 The unit revenues and costs are given in the table below. Product Eggs Unit Revenue $1.76 $2.69 $3.29 Unit Cost $0.98 $1.88 $2.03 Chicken Turkey Each product has a separate display with an associated foxed monthly cost: Product Eggs Chicken Turkey Fixed Monthly Display Cost $99 $229 $309 1. (5pts) Build a table for the cumulative probability distribution for demand. It should be set up for use with the VLOOKUP function, with the cumulative probabilities on the left. 2. (15pts) Build a table for tracking sales over one year (Jan 2021-Dec 2021) with separate columns for Eggs, Chicken and Turkey. This will just be the randomized demand value for each item for each month (like in 10.1.2 from the lab exercise on Monte Carlo simulations). For this assignment, assume all demand is actually met (that is, sales = demand) and there is no other inventory loss except through sales 3. (10pts) Build a table for tracking total revenues, costs, and profit for the year. This table should use the information provided in your answer to 2., above. Your table should calculate values for Total Revenue (based on the combined sales of all three products over the year) Total Cost (also based on combined sales, and including cost of goods sold and fixed costs) Profit/Loss (total revenue minus total costs) 4. (10pts) Create a data table to generate 50 runs of the simulation and calculate the average profit of the 50 simulation runs. As in previous assignments, this must be an actual data table structure to earn full credit. Calculate the average profit over the 50 simulation runs

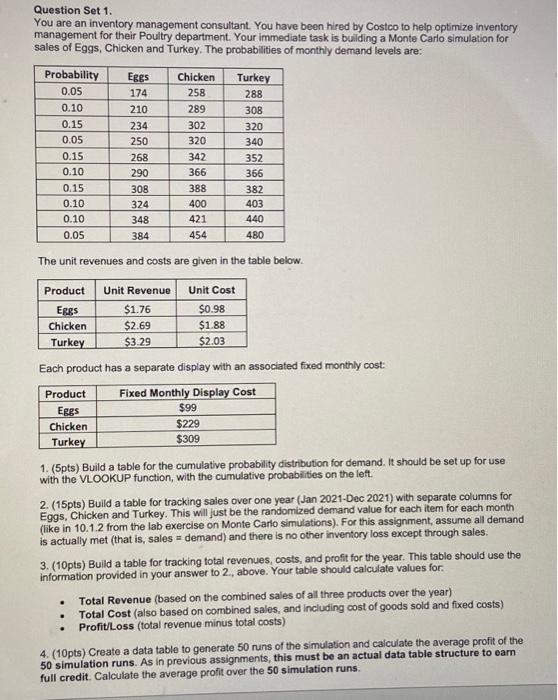
Step by Step Solution

There are 3 Steps involved in it

1 Expert Approved Answer
Step: 1 Unlock blur-text-image
Question Has Been Solved by an Expert!

Get step-by-step solutions from verified subject matter experts

Step: 2 Unlock
Step: 3 Unlock

Students Have Also Explored These Related General Management Questions!