

Question: please include as many steps as possible Graph the NPV profile Year Cash Flow -1000 800 1000 900 700 -2500 Please plot how the NPV
please include as many steps as possible 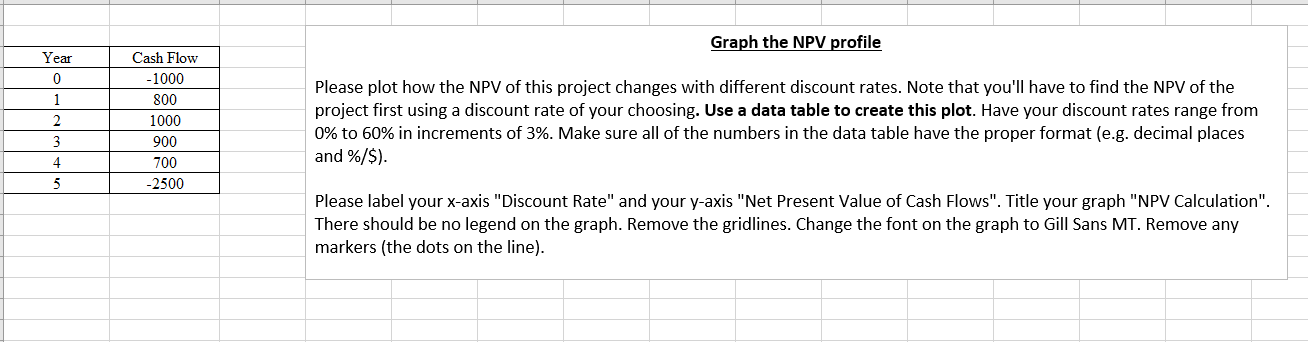
Graph the NPV profile Year Cash Flow -1000 800 1000 900 700 -2500 Please plot how the NPV of this project changes with different discount rates. Note that you'll have to find the NPV of the project first using a discount rate of your choosing. Use a data table to create this plot. Have your discount rates range from 0% to 60% in increments of 3%. Make sure all of the numbers in the data table have the proper format (e.g. decimal places and %/$). Please label your x-axis "Discount Rate" and your y-axis "Net Present Value of Cash Flows". Title your graph "NPV Calculation". There should be no legend on the graph. Remove the gridlines. Change the font on the graph to Gill Sans MT. Remove any markers (the dots on the line)
Step by Step Solution
There are 3 Steps involved in it

Get step-by-step solutions from verified subject matter experts