

Question: Large companies typically collect volumes of data before designing a product, not only to gain information as to whether the product should be released,
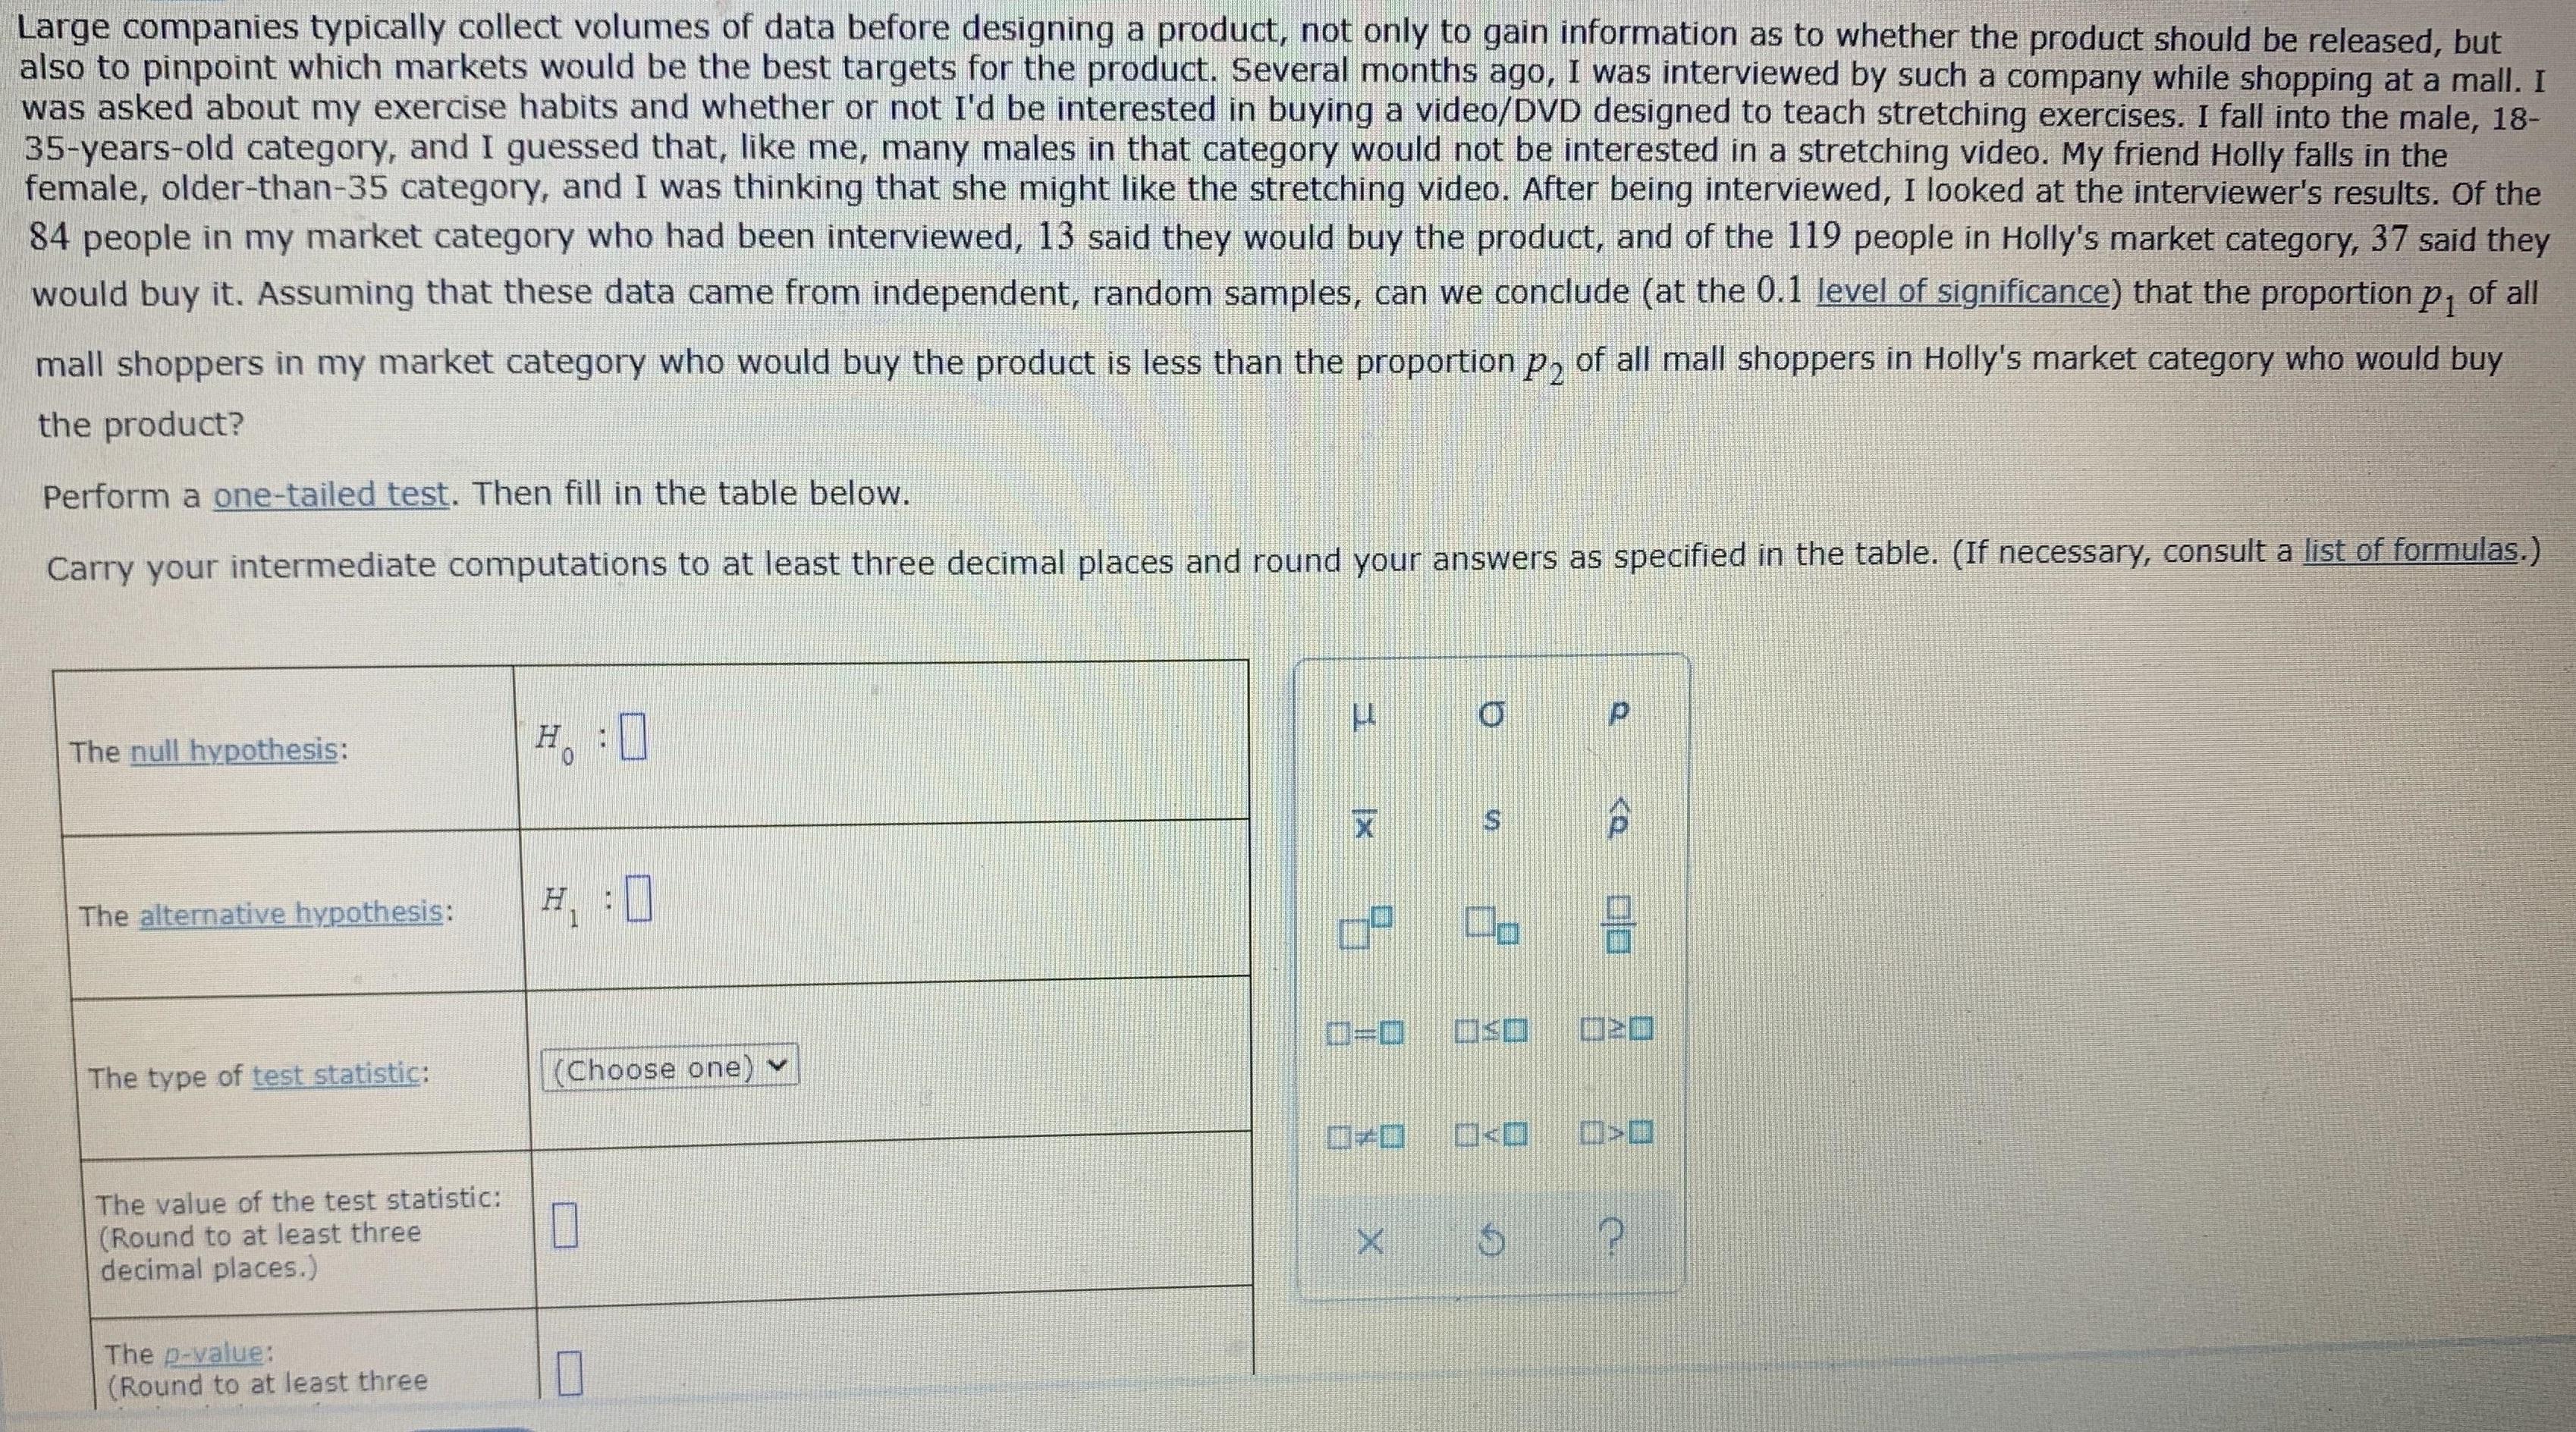
Large companies typically collect volumes of data before designing a product, not only to gain information as to whether the product should be released, but also to pinpoint which markets would be the best targets for the product. Several months ago, I was interviewed by such a company while shopping at a mall. I was asked about my exercise habits and whether or not I'd be interested in buying a video/DVD designed to teach stretching exercises. I fall into the male, 18- 35-years-old category, and I guessed that, like me, many males in that category would not be interested in a stretching video. My friend Holly falls in the female, older-than-35 category, and I was thinking that she might like the stretching video. After being interviewed, I looked at the interviewer's results. Of the 84 people in my market category who had been interviewed, 13 said they would buy the product, and of the 119 people in Holly's market category, 37 said they would buy it. Assuming that these data came from independent, random samples, can we conclude (at the 0.1 level of significance) that the proportion p of all mall shoppers in my market category who would buy the product is less than the proportion P2 of all mall shoppers in Holly's market category who would buy the product? Perform a one-tailed test. Then fill in the table below. Carry your intermediate computations to at least three decimal places and round your answers as specified in the table. (If necessary, consult a list of formulas.) P The null hypothesis: H:0 Ho X I The alternative hypothesis: 19 0=0 The type of test statistic: (Choose one) The value of the test statistic: 0 (Round to at least three decimal places.) The p-value: (Round to at least three USO 0 P
Step by Step Solution
3.32 Rating (149 Votes )
There are 3 Steps involved in it

Get step-by-step solutions from verified subject matter experts