

A nationwide standardized test taken by high-school juniors and seniors may or may not measure academic...
Fantastic news! We've Found the answer you've been seeking!
Question:
Transcribed Image Text:
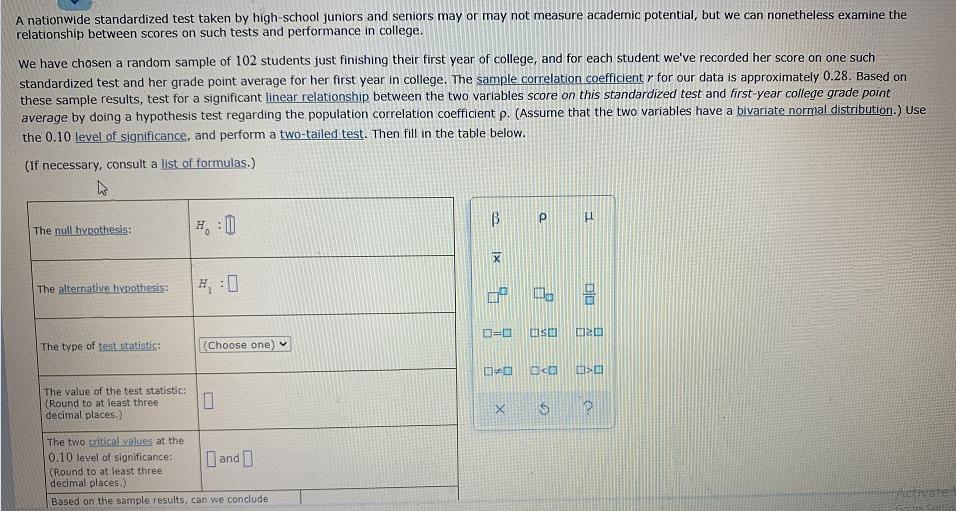
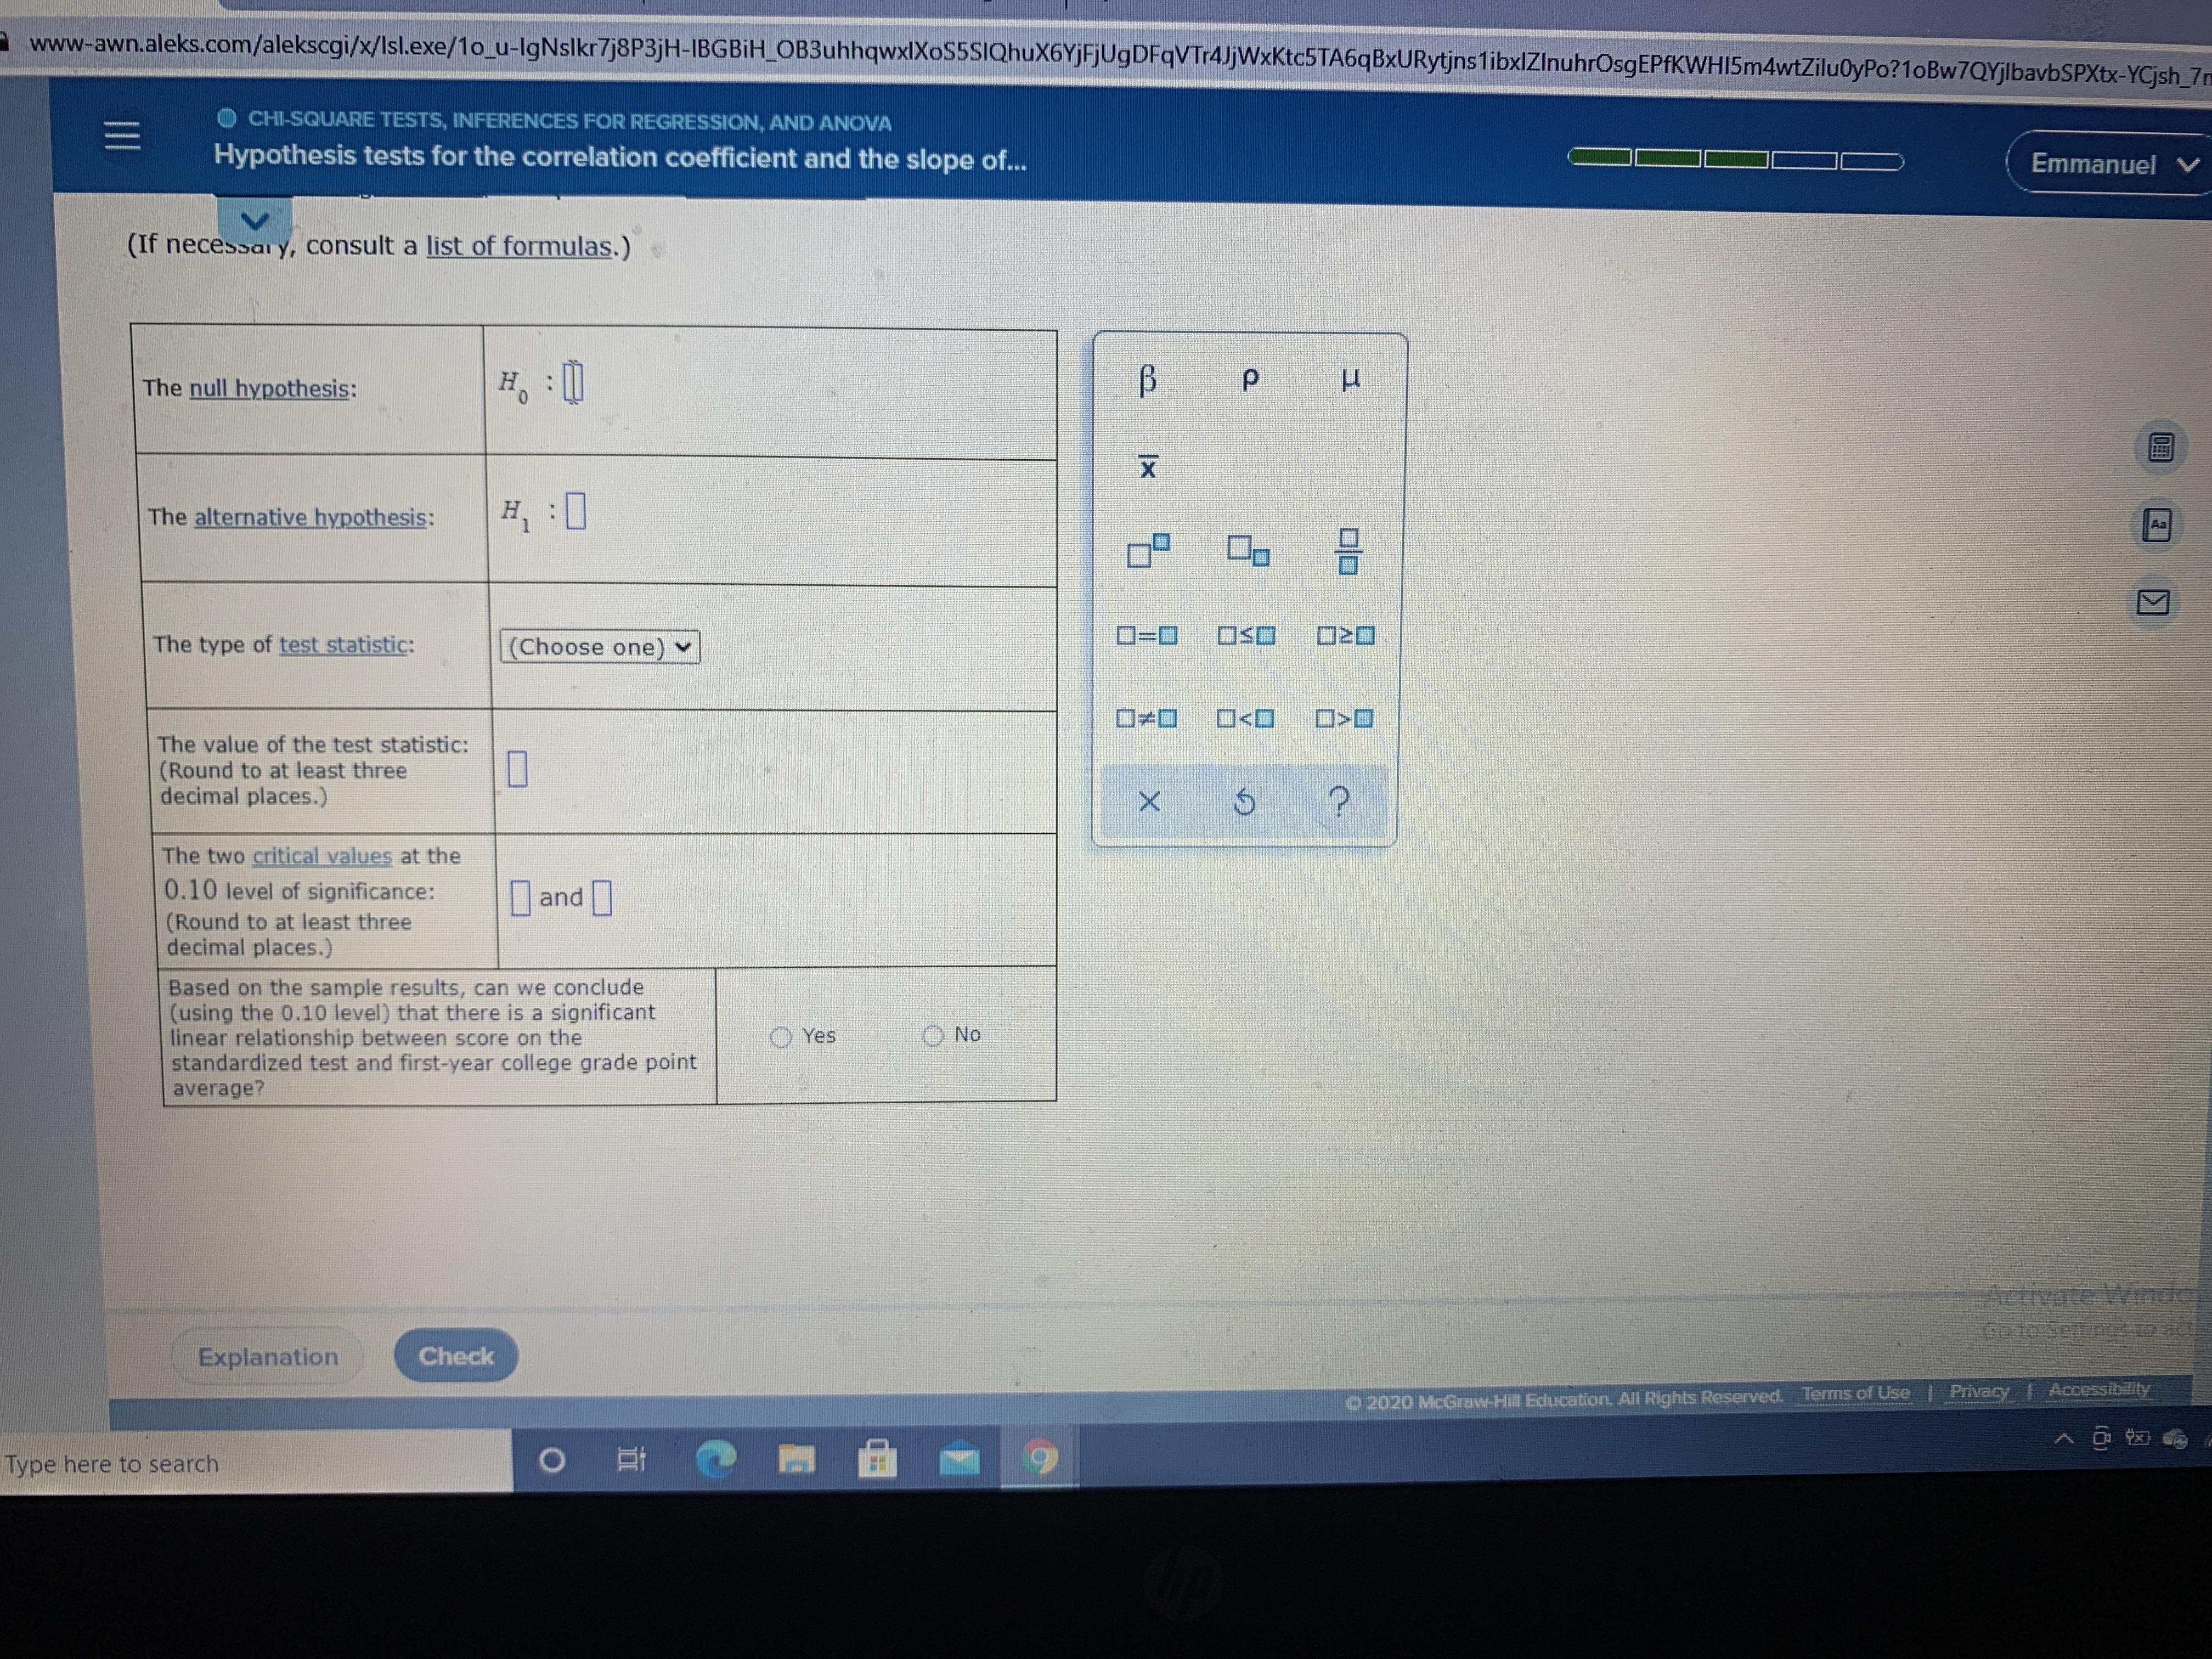
A nationwide standardized test taken by high-school juniors and seniors may or may not measure academic potential, but we can nonetheless examine the relationship between scores on such tests and performance in college. We have chosen a random sample of 102 students just finishing their first year of college, and for each student we've recorded her score on one such standardized test and her grade point average for her first year in college. The sample correlation coefficient r for our data is approximately 0.28. Based on these sample results, test for a significant linear relationship between the two variables score on this standardized test and first-year college grade point average by doing a hypothesis test regarding the population correlation coefficient p. (Assume that the two variables have a bivariate normal distribution.) Use the 0.10 level of significance, and perform a two-tailed test. Then fill in the table below. (If necessary, consult a list of formulas.) #:0 The null hypothesis: The alternative hypothesis: # :0 D=0 OSO The type of test statistic: (Choose one) - The value of the test statistic: (Round to at least three decimal places.) The two critical values at the 0,10 level of significance: Dand (Round to at least three decimal places.) Activate Based on the sample results, can we conclude 口口 www-awn.aleks.com/alekscgi/x/Isl.exe/1o_u-lgNslkr7j8P3jH-IBGBİH_OB3uhhqwxlXoS5SIQhuX6YjFjUgDFqVTr4JjWxKtc5TA6qBxURytjns1ibxlZlnuhrOsgEPfKWHI5m4wtZiluOyPo?1oBw7QYjlbavbSPXtx-YCjsh_7m O CHI-SQUARE TESTS, INFERENCES FOR REGRESSION, AND ANOVA Hypothesis tests for the correlation coefficient and the slope of... Emmanuel V (If necessary, consult a list of formulas.) The null hypothesis: H, : [D The alternative hypothesis: H :0 Aa D=D0 The type of test statistic: (Choose one)Y ロ<ロ The value of the test statistic: (Round to at least three decimal places.) The two critical values at the 0.10 level of significance: (Round to at least three decimal places.) | and| Based on the sample results, can we conclude (using the 0.10 level) that there is a significant linear relationship between score on the standardized test and first-year college grade point average? Yes No Activate Winde Explanation Check 2020 McGraw-Hill Education. All Rights Reserved. Terms of Use Privacy I Accessibility Type here to search | 耳。 |x II A nationwide standardized test taken by high-school juniors and seniors may or may not measure academic potential, but we can nonetheless examine the relationship between scores on such tests and performance in college. We have chosen a random sample of 102 students just finishing their first year of college, and for each student we've recorded her score on one such standardized test and her grade point average for her first year in college. The sample correlation coefficient r for our data is approximately 0.28. Based on these sample results, test for a significant linear relationship between the two variables score on this standardized test and first-year college grade point average by doing a hypothesis test regarding the population correlation coefficient p. (Assume that the two variables have a bivariate normal distribution.) Use the 0.10 level of significance, and perform a two-tailed test. Then fill in the table below. (If necessary, consult a list of formulas.) #:0 The null hypothesis: The alternative hypothesis: # :0 D=0 OSO The type of test statistic: (Choose one) - The value of the test statistic: (Round to at least three decimal places.) The two critical values at the 0,10 level of significance: Dand (Round to at least three decimal places.) Activate Based on the sample results, can we conclude 口口 www-awn.aleks.com/alekscgi/x/Isl.exe/1o_u-lgNslkr7j8P3jH-IBGBİH_OB3uhhqwxlXoS5SIQhuX6YjFjUgDFqVTr4JjWxKtc5TA6qBxURytjns1ibxlZlnuhrOsgEPfKWHI5m4wtZiluOyPo?1oBw7QYjlbavbSPXtx-YCjsh_7m O CHI-SQUARE TESTS, INFERENCES FOR REGRESSION, AND ANOVA Hypothesis tests for the correlation coefficient and the slope of... Emmanuel V (If necessary, consult a list of formulas.) The null hypothesis: H, : [D The alternative hypothesis: H :0 Aa D=D0 The type of test statistic: (Choose one)Y ロ<ロ The value of the test statistic: (Round to at least three decimal places.) The two critical values at the 0.10 level of significance: (Round to at least three decimal places.) | and| Based on the sample results, can we conclude (using the 0.10 level) that there is a significant linear relationship between score on the standardized test and first-year college grade point average? Yes No Activate Winde Explanation Check 2020 McGraw-Hill Education. All Rights Reserved. Terms of Use Privacy I Accessibility Type here to search | 耳。 |x II
Expert Answer:

Related Book For 

Data Analysis and Decision Making
ISBN: 978-0538476126
4th edition
Authors: Christian Albright, Wayne Winston, Christopher Zappe
Posted Date:
Students also viewed these mathematics questions
-
Based on the MTF11SSD, examine the relationship between a teen's race (RACE) and the number of friends who drink alcohol (FRDRINK) and smoke cigarettes (FRSMOKE). Using SPSS Crosstabs, create two...
-
A researcher conducts an experiment to examine the relationship between the weight gain of chickens whose diets had been supplemented by different amounts of the amino acid lysine and the amount of...
-
Use GSS 2010 to examine the relationship between respondents health (HEALTH) and social class (CLASS). Treat social class as the independent variable. a. Request the appropriate measures of...
-
Metro Credit Union in Charlottetown, Prince Edward Island, loaned $90,000 to David Mann on a six-month, 8% note. Record the following for Metro Credit Union: a. Lending the money on March 6. b....
-
What is a post-audit, why do firms use them, and what problems can arise when they are used?
-
You are conducting a marketing research project for Starbucks Coffee. Research online to determine the main factors affecting consumer preference for certain coffee brands. Also, determine the...
-
Suppose that 4 of 13 undergraduate engineering students are going on to graduate school. Test the dean's claim that \(60 \%\) of the undergraduate students will go on to graduate school, using the...
-
Finding the WACC given the following information for Bellevue Power Co, find the WACC. Assume the companys tax rate is 35 percent. Deb:5,000 7 percent coupon bonds outstanding, $1,000 par value, 20...
-
The position of a particle moving along the x axis is given in centimeters by x = 9.36 + 1.34 t 3 , where t is in seconds. Calculate (a) the average velocity during the time interval t = 2.00 s to t...
-
You are to record transactions completed by Fabulous Furnishings during February of this year. Beginning balances for the accounts listed below have been provided in your Working Papers. This Company...
-
what ways does social constructionism inform our understanding of social change and social movements, highlighting the transformative potential of collective action in reshaping social realities and...
-
Which of the following is not one of the five major classifications of financial statement fraud? 1. Fictitious revenues 2. Improper disclosures 3. Concealed liabilities 4. Channel stuffing
-
What is a multiple bar graph, and how is it helpful?
-
Find two examples of data distributions in recent news reports; they may be given either as tables or as graphs. In each case, state the range of the distribution and explain its meaning in the...
-
This section consists of some true/false questions regarding concepts of statistical inference. Indicate whether a statement is true or false and, if false, indicate what is required to make the...
-
Figure 10 shows a histogram for the weights of 50 randomly selected quarters. The mean weight is 5.62 grams. Is this distribution close to normal? Should this variable have a normal distribution? Why...
-
Briefly describe the type/goal of the attack that you are launching; 2. Describe the scenario that you encounter as it pertains to time stamps; 3. Describe your approach to obfuscating your attack's...
-
Fahrad Inc. sells all of its product on account. Fahrad has the following accounts receivable payment experience: Percent paid in the month of sale .........10 Percent paid in the month after the...
-
A retired partner from a large brokerage firm has one million dollars available to invest in particular stocks or bonds. Each investments annual rate of return depends on the state of the economy in...
-
In Example 16.2, the gamma distribution was used to model the skewness to the right of the lifetime distribution. Experiment to see whether the triangular distribution could have been used instead....
-
Suppose you buy an electronic device that you operate continuously. The device costs you $300 and carries a one-year warranty. The warranty states that if the device fails during its first year of...
-
Differentiate between a heat pump and a refrigerator.
-
Define COP of a heat pump and a refrigerator.
-
Define the term Entropy.

Study smarter with the SolutionInn App