

Question: A nationwide standardized test taken by high-school juniors and seniors may or may not measure academic potential, but we can nonetheless examine the relationship
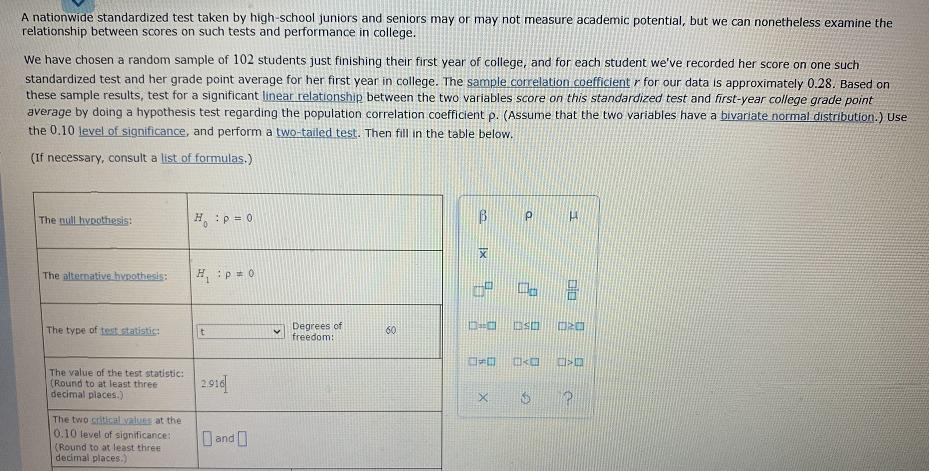
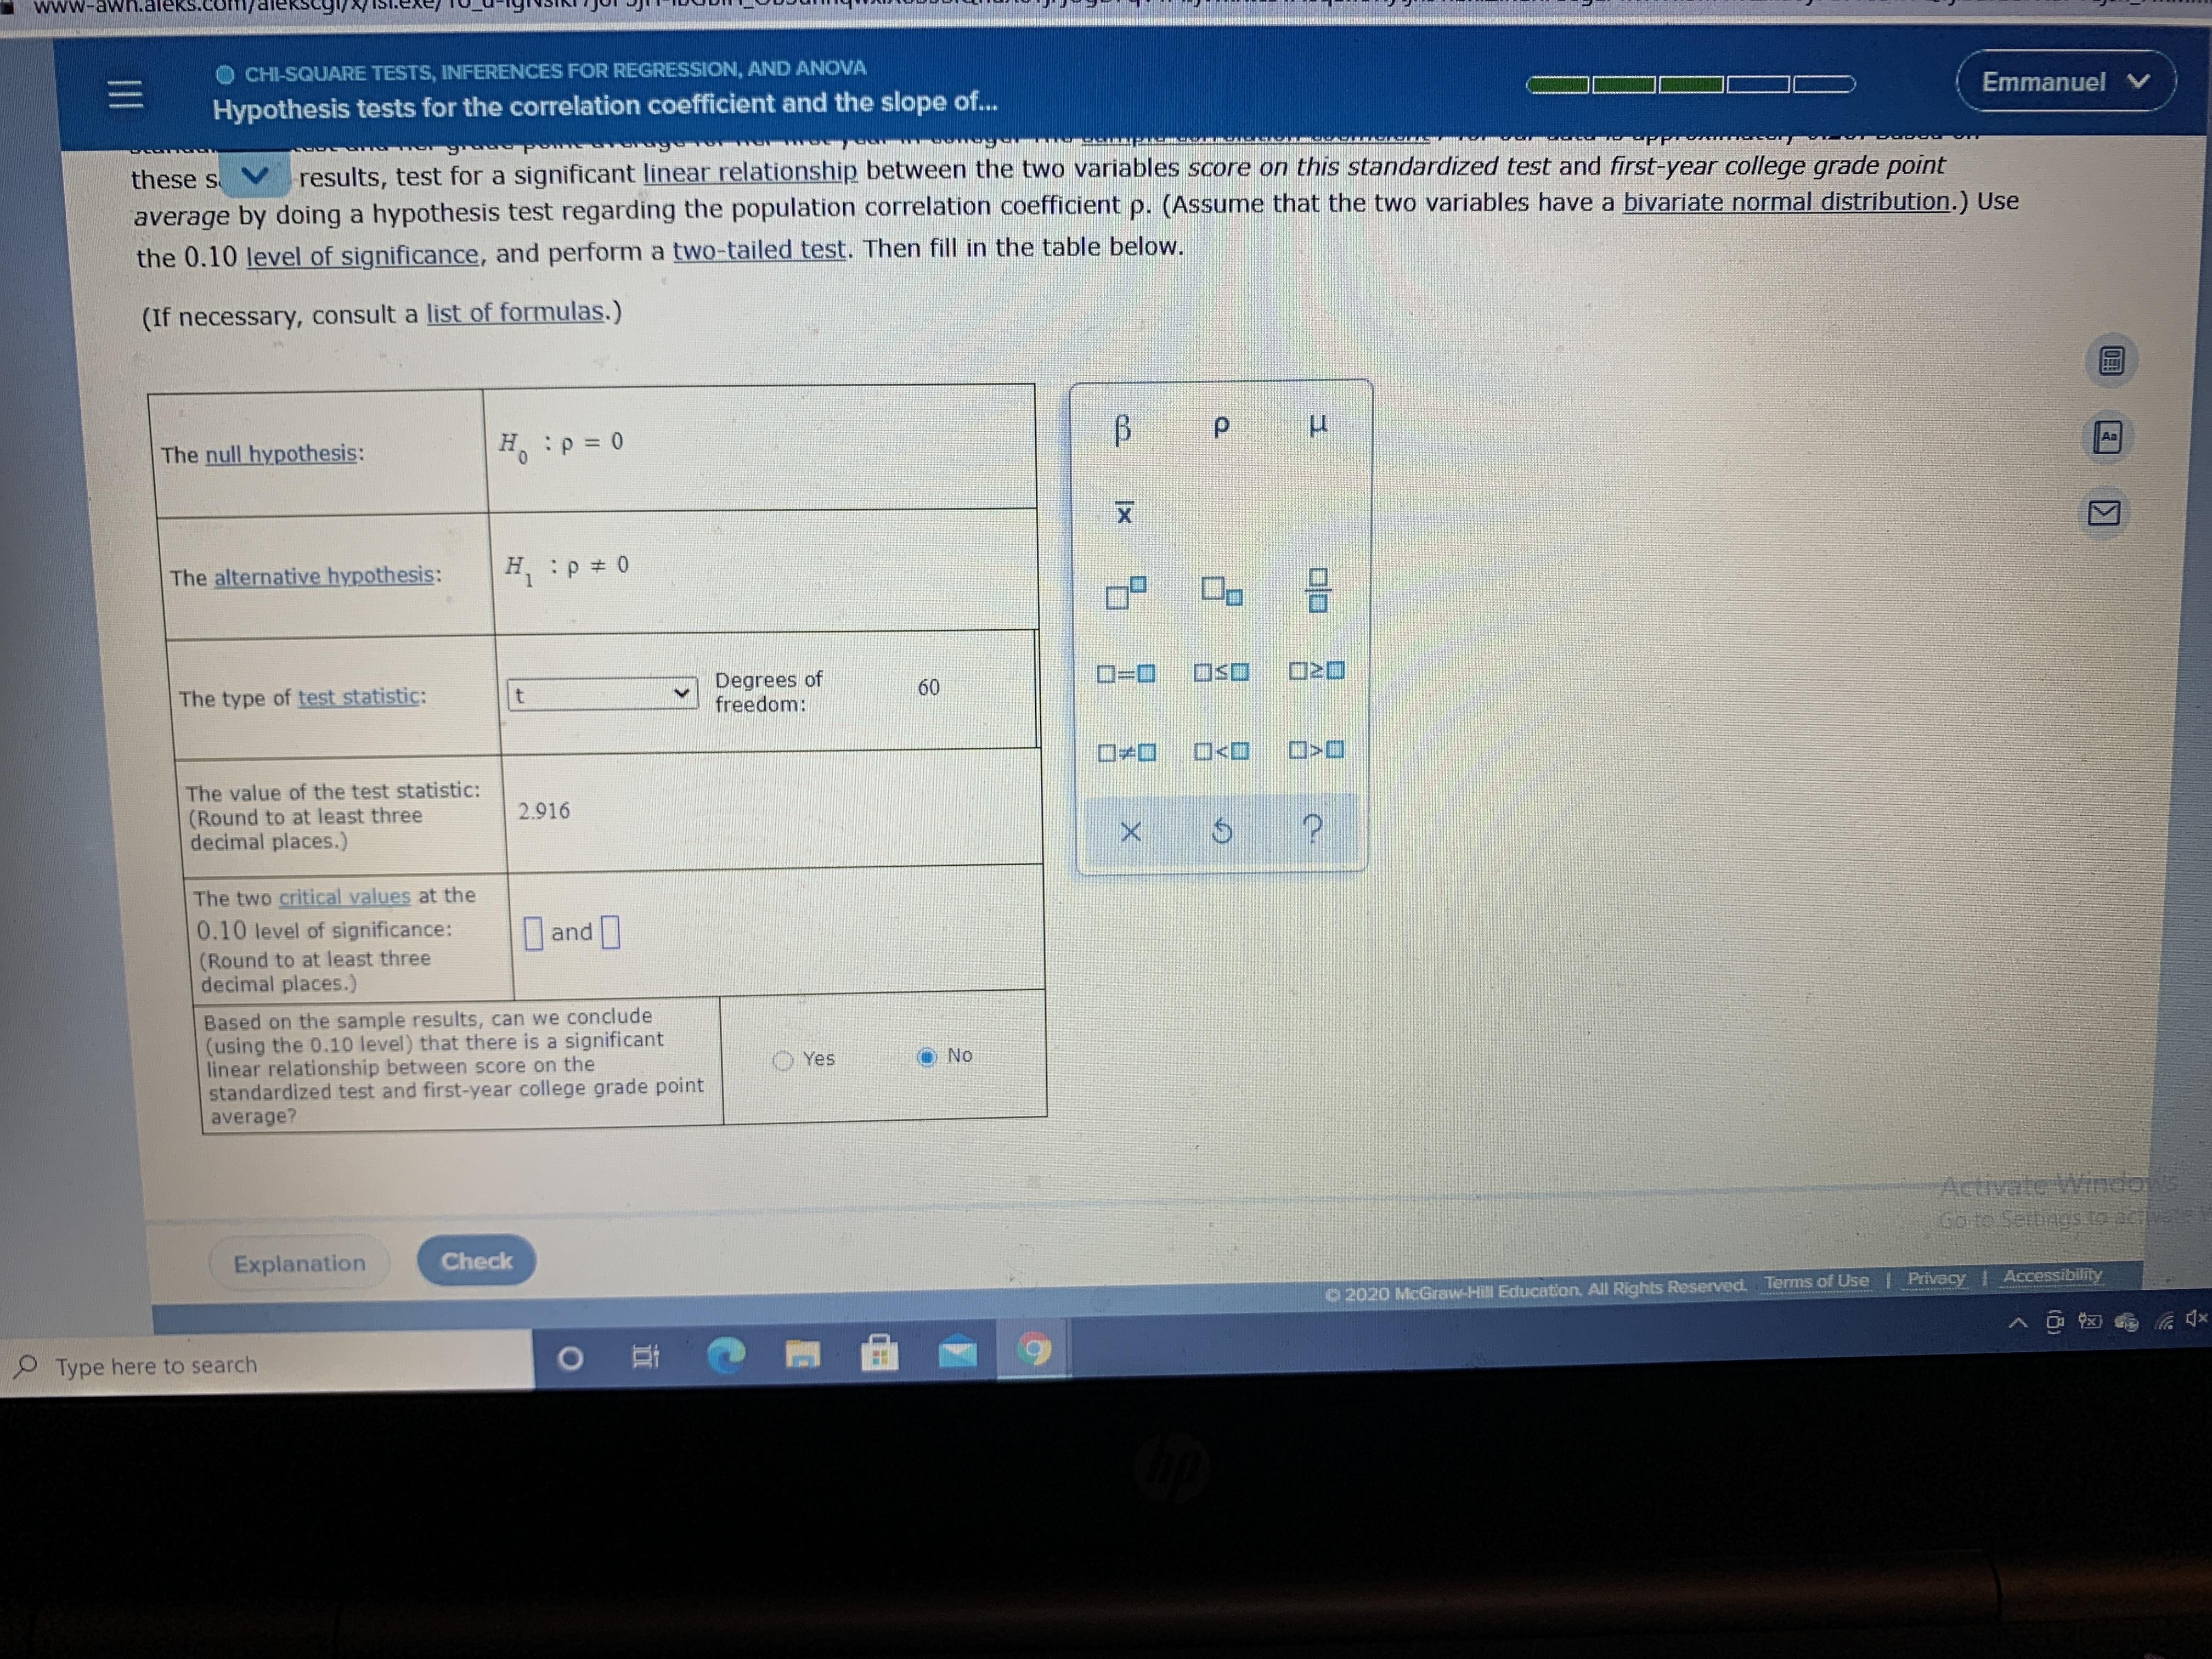
A nationwide standardized test taken by high-school juniors and seniors may or may not measure academic potential, but we can nonetheless examine the relationship between scores on such tests and performance in college. We have chosen a random sample of 102 students just finishing their first year of college, and for each student we've recorded her score on one such standardized test and her grade point average for her first year in college. The sample correlation coefficient r for our data is approximately 0.28. Based on these sample results, test for a significant linear relationship between the two variables score on this standardized test and first-year college grade point average by doing a hypothesis test regarding the population correlation coefficient p. (Assume that the two variables have a bivariate normal distribution.) Use the 0.10 level of significance, and perform a two-tailed test. Then fill in the table below. (If necessary, consult a list of formulas.) The null hypothesis: 0 = d: H The alternative hvpothesis: The type of test.statistic: Degrees of freedom: 60 The value of the test statistic: (Round to at least three decimal places.) 291d The two sriticalvalues at the 0.10 level of significance: (Round to at least three decimal places.) and www-awh.a Ks.com/aleEkscgi/. CHI-SQUARE TESTS, INFERENCES FOR REGRESSION, AND ANOVA Emmanuel v Hypothesis tests for the correlation coefficient and the slope of... results, test for a significant linear relationship between the two variables score on this standardized test and first-year college grade point average by doing a hypothesis test regarding the population correlation coefficient p. (Assume that the two variables have a bivariate normal distribution.) Use these s V the 0.10 level of significance, and perform a two-tailed test. Then fill in the table below. (If necessary, consult a list of formulas.) Aa The null hypothesis: H:p=D0 The alternative hypothesis: H, p # 0 = 2 Degrees of freedom: 60 The type of test statistic: O
Step by Step Solution
3.58 Rating (158 Votes )
There are 3 Steps involved in it

Get step-by-step solutions from verified subject matter experts