

Question: PLEASE INCLUDE EXCEL FORMULAS. DATA TO PASTE TO EXCEL: U.S. TREASURY STRIP DATA Current date 22-Jun-2015 Price Maturity Yahoo yield 99.996 15-Aug-2015 0.020% 99.964 15-Nov-2015
 PLEASE INCLUDE EXCEL FORMULAS.
DATA TO PASTE TO EXCEL:
| U.S. TREASURY STRIP DATA | ||
| Current date | 22-Jun-2015 | |
| Price | Maturity | Yahoo yield |
| 99.996 | 15-Aug-2015 | 0.020% |
| 99.964 | 15-Nov-2015 | 0.090% |
| 99.874 | 15-Feb-2016 | 0.190% |
| 99.7095 | 15-May-2016 | 0.320% |
| 99.551 | 15-Aug-2016 | 0.390% |
| 99.333 | 15-Nov-2016 | 0.480% |
| 98.7775 | 15-May-2017 | 0.640% |
| 98.787 | 15-May-2017 | 0.640% |
| 98.4465 | 15-Aug-2017 | 0.730% |
| 97.2295 | 15-May-2018 | 0.970% |
| 96.0995 | 15-Nov-2018 | 1.170% |
| 95.4985 | 15-Feb-2019 | 1.260% |
| 94.09 | 15-Aug-2019 | 1.470% |
| 92.7465 | 15-Feb-2020 | 1.620% |
| 92.6395 | 29-Feb-2020 | 1.630% |
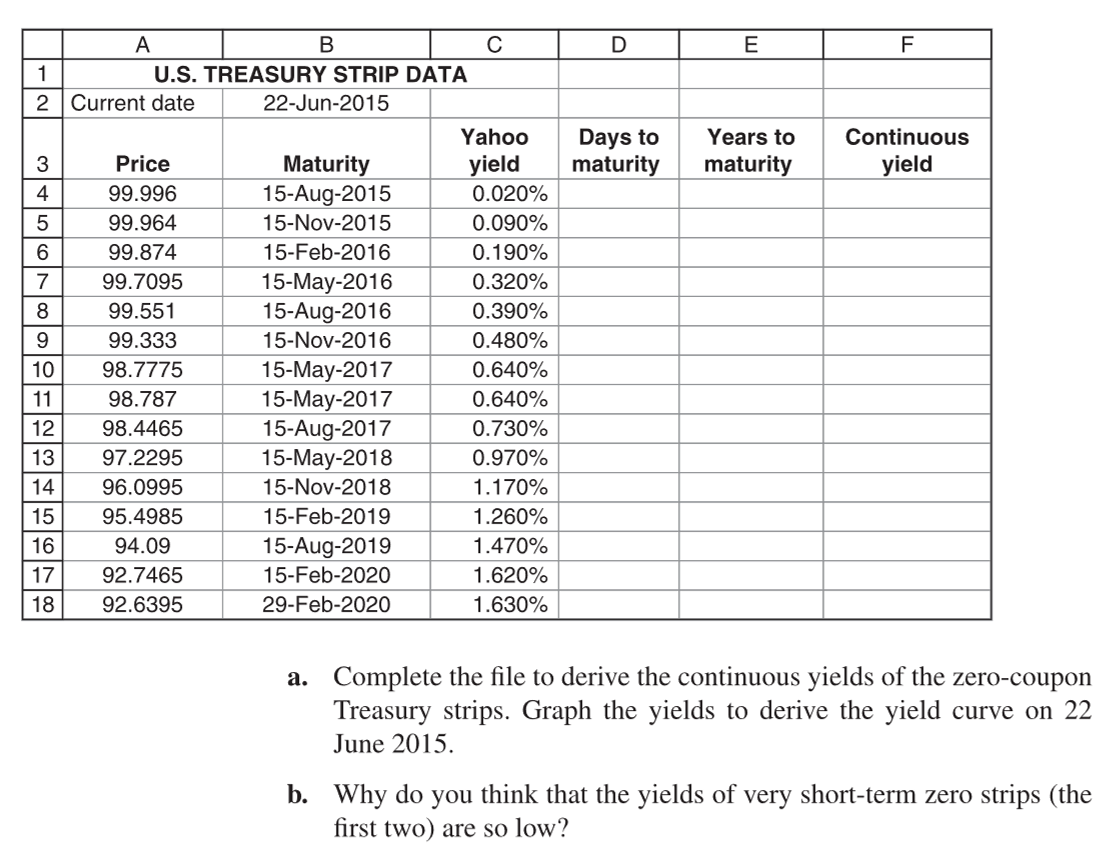
D E F 1 2 Days to maturity Years to maturity Continuous yield 3 4 5 6 7 8 B U.S. TREASURY STRIP DATA Current date 22-Jun-2015 Yahoo Price Maturity yield 99.996 15-Aug-2015 0.020% 99.964 15-Nov-2015 0.090% 99.874 15-Feb-2016 0.190% 99.7095 15-May-2016 0.320% 99.551 15-Aug-2016 0.390% 99.333 15-Nov-2016 0.480% 98.7775 15-May-2017 0.640% 98.787 15-May-2017 0.640% 98.4465 15-Aug-2017 0.730% 97.2295 15-May-2018 0.970% 96.0995 15-Nov-2018 1.170% 95.4985 15-Feb-2019 1.260% 94.09 15-Aug-2019 1.470% 92.7465 15-Feb-2020 1.620% 92.6395 29-Feb-2020 1.630% 9 10 11 12 13 14 15 16 17 18 a. Complete the file to derive the continuous yields of the zero-coupon Treasury strips. Graph the yields to derive the yield curve on 22 June 2015. b. Why do you think that the yields of very short-term zero strips (the first two) are so low? D E F 1 2 Days to maturity Years to maturity Continuous yield 3 4 5 6 7 8 B U.S. TREASURY STRIP DATA Current date 22-Jun-2015 Yahoo Price Maturity yield 99.996 15-Aug-2015 0.020% 99.964 15-Nov-2015 0.090% 99.874 15-Feb-2016 0.190% 99.7095 15-May-2016 0.320% 99.551 15-Aug-2016 0.390% 99.333 15-Nov-2016 0.480% 98.7775 15-May-2017 0.640% 98.787 15-May-2017 0.640% 98.4465 15-Aug-2017 0.730% 97.2295 15-May-2018 0.970% 96.0995 15-Nov-2018 1.170% 95.4985 15-Feb-2019 1.260% 94.09 15-Aug-2019 1.470% 92.7465 15-Feb-2020 1.620% 92.6395 29-Feb-2020 1.630% 9 10 11 12 13 14 15 16 17 18 a. Complete the file to derive the continuous yields of the zero-coupon Treasury strips. Graph the yields to derive the yield curve on 22 June 2015. b. Why do you think that the yields of very short-term zero strips (the first two) are so low
Step by Step Solution
There are 3 Steps involved in it

Get step-by-step solutions from verified subject matter experts