

Question: please include excel formulas Portfolio analysis You have been given the historical return data shown in the first table on three assets - F, G,
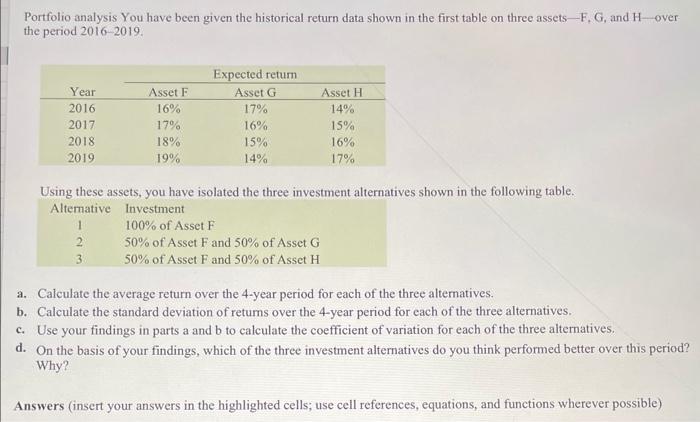
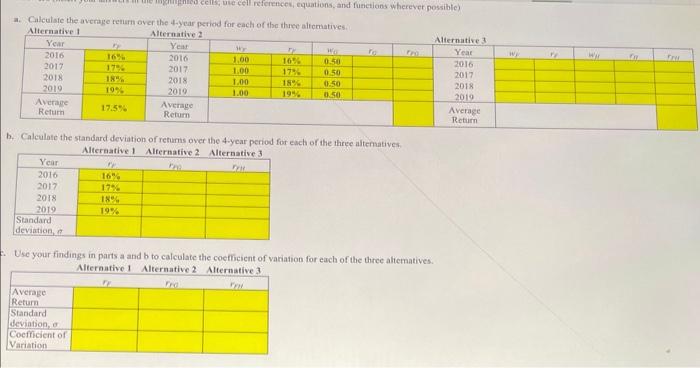

Portfolio analysis You have been given the historical return data shown in the first table on three assets - F, G, and H-over the period 20162019. Using these assets, you have isolated the three investment alternatives shown in the following table. a. Calculate the average return over the 4-year period for each of the three alternatives. b. Calculate the standard deviation of retums over the 4-year period for each of the three alternatives. c. Use your findings in parts a and b to calculate the coefficient of variation for each of the three alternatives. d. On the basis of your findings, which of the three investment alternatives do you think performed better over this period? Why? Answers (insert your answers in the highlighted cells; use cell references, equations, and functions wherever possible) a. Calculate the avernge teturn over the 4y ear period for cach of the thee altematives. b. Calculate the standard deviation of returns over the 4 -year period for each of the three alitenatives. Altereative i Use your findings in parts a and b to calculate the coeficicnt of vatiaion for each of the three aliematives. Alteraative 1 d. On the basis of your findings, which of the three investment alternatives do you think performed better over this period? Why
Step by Step Solution
There are 3 Steps involved in it

Get step-by-step solutions from verified subject matter experts