

Question: Please include excel formulas used for each calulation and provide short statement on findings/recommendations. You are working in a strategic management role at Best Bean,
Please include excel formulas used for each calulation and provide short statement on findings/recommendations.
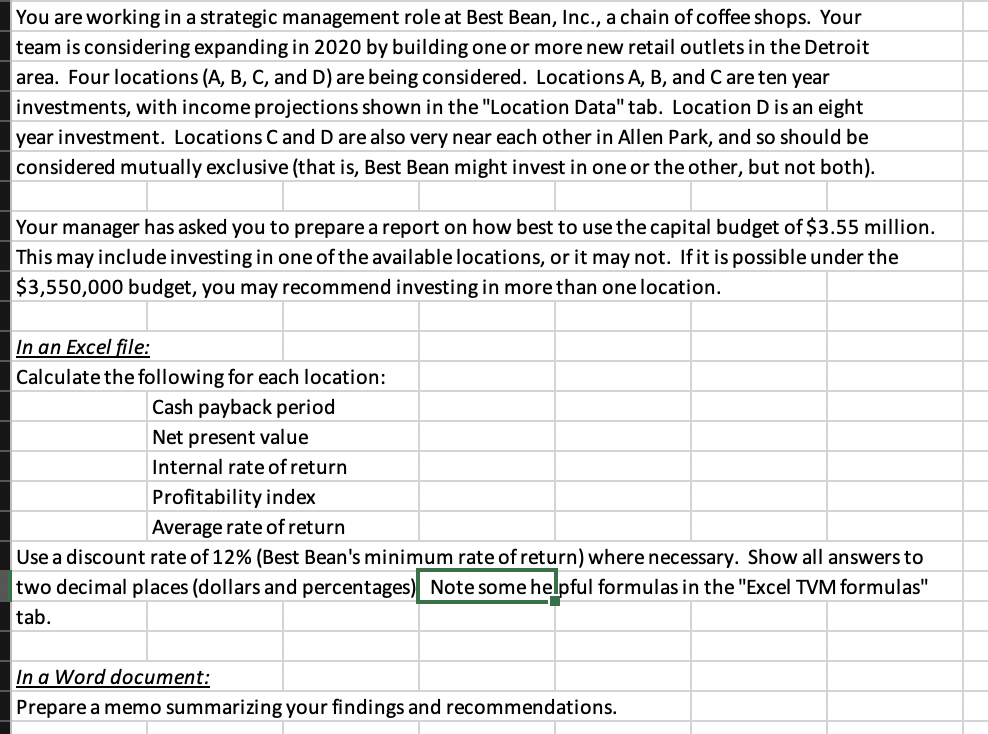
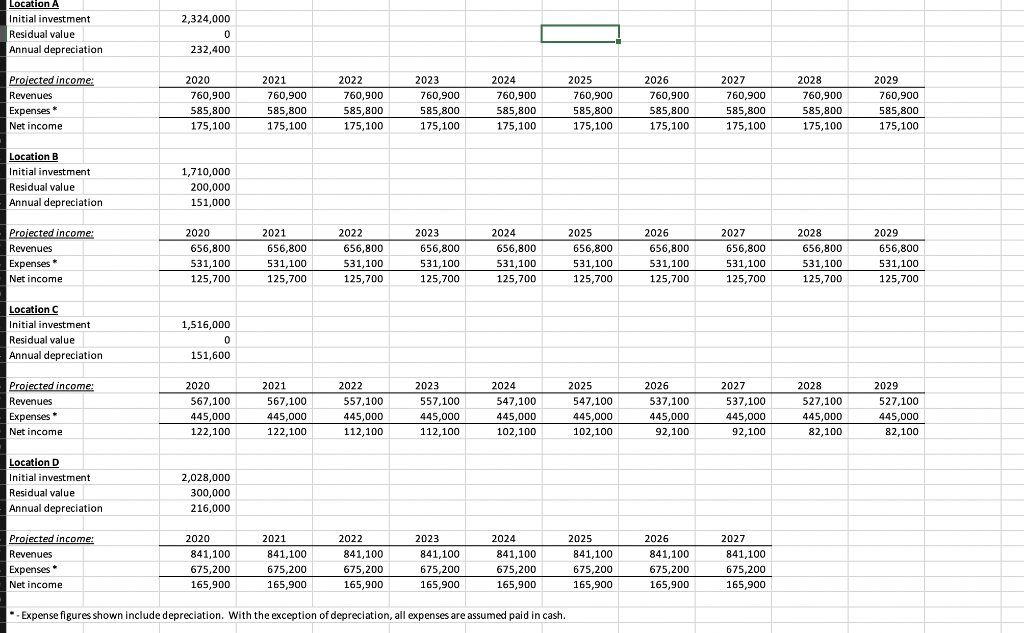
You are working in a strategic management role at Best Bean, Inc., a chain of coffee shops. Your team is considering expanding in 2020 by building one or more new retail outlets in the Detroit area. Four locations (A, B, C, and D) are being considered. Locations A, B, and Care ten year investments, with income projections shown in the "Location Data" tab. Location D is an eight year investment. Locations C and D are also very near each other in Allen Park, and so should be considered mutually exclusive (that is, Best Bean might invest in one or the other, but not both). Your manager has asked you to prepare a report on how best to use the capital budget of $3.55 million. This may include investing in one of the available locations, or it may not. If it is possible under the $3,550,000 budget, you may recommend investing in more than one location. Calculate the following for each location: Cash payback period Net present value Internal rate of return Profitability index Average rate of return Use a discount rate of 12% (Best Bean's minimum rate of return) where necessary. Show all answers to two decimal places (dollars and percentages) Note some helpful formulas in the "Excel TVM formulas" tab. In a Word document: Prepare a memo summarizing your findings and recommendations. 2,324,000 Location A Initial investment Residual value Annual depreciation 232,400 Projected income: Revenues Expenses * Net income 2020 760,900 585,800 2029 760,900 2021 760,900 585,800 175,100 2022 760,900 585,800 175,100 2023 760,900 585,800 175,100 2024 760,900 585,800 175,100 2025 760,900 585,800 175,100 2026 760,900 5 85,800 175,100 2027 760,900 585,800 175,100 2028 760,900 585,800 175,100 175,100 Location B Initial investment Residual value - Annual depreciation 1,710,000 200,000 151,000 2025 - Projected income: Revenues Expenses * Net income 2020 656,800 531,100 125,700 2021 656,800 531,100 125,700 2022 656,800 531,100 125,700 2023 656,800 531,100 125,700 2024 656,800 531,100 125,700 6 56,800 531,100 125,700 2026 656,800 531,100 125,700 2027 656,800 531,100 125,700 2028 656,800 531,100 125,700 2029 656,800 531,100 125,700 1,516,000 Location C Initial investment Residual value Annual depreciation 151,600 2027 Projected income: Revenues Expenses Net income 2020 567,100 445,000 122,100 2021 567,100 445,000 122,100 2022 557,100 445,000 112,100 2023 557,100 445,000 112,100 2024 547,100 445,000 102,100 2025 547,100 445,000 102,100 2026 537,100 445,000 92,100 2028 527,100 445,000 82,100 2029 527,100 445,000 82,100 445,000 92,100 Location D Initial investment Residual value Annual depreciation 2,028,000 300,000 216,000 Projected income: Revenues Expenses Net income 2020 841,100 675,200 165,900 2021 841,100 675,200 165,900 2022 841,100 675,200 165,900 2023 841,100 675,200 165,900 2024 841,100 675,200 165,900 2025 2026 841.100 841 100 841,100 6 75,200 675,200 165,900 165,900 2027 8 41,100 675,200 165,900 - Expense figures shown include depreciation. With the exception of depreciation, all expenses are assumed paid in cash. You are working in a strategic management role at Best Bean, Inc., a chain of coffee shops. Your team is considering expanding in 2020 by building one or more new retail outlets in the Detroit area. Four locations (A, B, C, and D) are being considered. Locations A, B, and Care ten year investments, with income projections shown in the "Location Data" tab. Location D is an eight year investment. Locations C and D are also very near each other in Allen Park, and so should be considered mutually exclusive (that is, Best Bean might invest in one or the other, but not both). Your manager has asked you to prepare a report on how best to use the capital budget of $3.55 million. This may include investing in one of the available locations, or it may not. If it is possible under the $3,550,000 budget, you may recommend investing in more than one location. Calculate the following for each location: Cash payback period Net present value Internal rate of return Profitability index Average rate of return Use a discount rate of 12% (Best Bean's minimum rate of return) where necessary. Show all answers to two decimal places (dollars and percentages) Note some helpful formulas in the "Excel TVM formulas" tab. In a Word document: Prepare a memo summarizing your findings and recommendations. 2,324,000 Location A Initial investment Residual value Annual depreciation 232,400 Projected income: Revenues Expenses * Net income 2020 760,900 585,800 2029 760,900 2021 760,900 585,800 175,100 2022 760,900 585,800 175,100 2023 760,900 585,800 175,100 2024 760,900 585,800 175,100 2025 760,900 585,800 175,100 2026 760,900 5 85,800 175,100 2027 760,900 585,800 175,100 2028 760,900 585,800 175,100 175,100 Location B Initial investment Residual value - Annual depreciation 1,710,000 200,000 151,000 2025 - Projected income: Revenues Expenses * Net income 2020 656,800 531,100 125,700 2021 656,800 531,100 125,700 2022 656,800 531,100 125,700 2023 656,800 531,100 125,700 2024 656,800 531,100 125,700 6 56,800 531,100 125,700 2026 656,800 531,100 125,700 2027 656,800 531,100 125,700 2028 656,800 531,100 125,700 2029 656,800 531,100 125,700 1,516,000 Location C Initial investment Residual value Annual depreciation 151,600 2027 Projected income: Revenues Expenses Net income 2020 567,100 445,000 122,100 2021 567,100 445,000 122,100 2022 557,100 445,000 112,100 2023 557,100 445,000 112,100 2024 547,100 445,000 102,100 2025 547,100 445,000 102,100 2026 537,100 445,000 92,100 2028 527,100 445,000 82,100 2029 527,100 445,000 82,100 445,000 92,100 Location D Initial investment Residual value Annual depreciation 2,028,000 300,000 216,000 Projected income: Revenues Expenses Net income 2020 841,100 675,200 165,900 2021 841,100 675,200 165,900 2022 841,100 675,200 165,900 2023 841,100 675,200 165,900 2024 841,100 675,200 165,900 2025 2026 841.100 841 100 841,100 6 75,200 675,200 165,900 165,900 2027 8 41,100 675,200 165,900 - Expense figures shown include depreciation. With the exception of depreciation, all expenses are assumed paid in cash
Step by Step Solution
There are 3 Steps involved in it

Get step-by-step solutions from verified subject matter experts