

Question: Please include Excel Formulas You have been tasked to manage the inventory at your company. Your boss thinks that inventory management is out of control,
Please include Excel Formulas
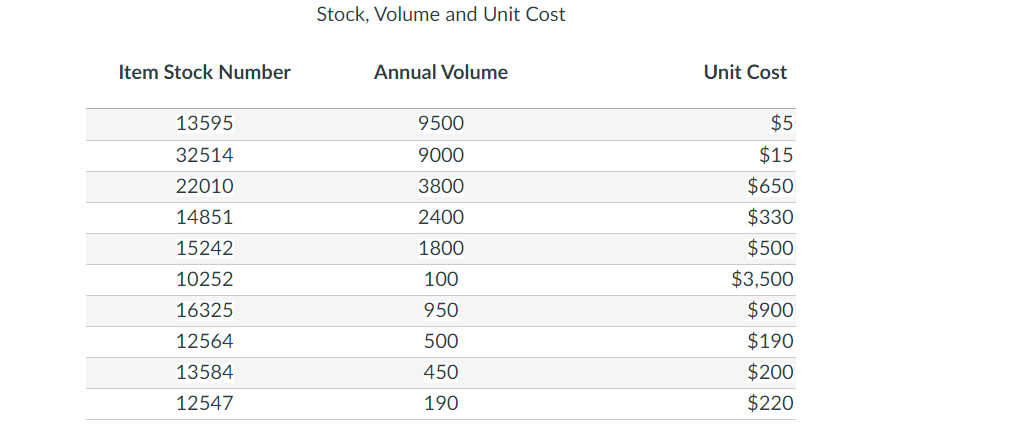
You have been tasked to manage the inventory at your company. Your boss thinks that inventory management is out of control, but is not sure and wants you to perform some analysis of the inventory and provide him with some data. This chart lists your current stock, annual volumes, and unit cost
Use Excel OM and the chart to conduct an ABC analysis to determine which category each of the parts falls into. Provide analysis and interpretation of the results.
In the Excel OM software, the default Percent of dollar volume for A items is 75%, however, it has been determined by your boss that he would like to see the data for the A items set at 80%.
Stock, Volume and Unit Cost Item Stock Number Annual Volume Unit Cost 9500 $5 $15 13595 32514 22010 14851 15242 10252 9000 3800 2400 1800 100 950 500 450 190 $650 $330 $500 $3.500 $900 $190 $200 $220 16325 12564 13584 12547Step by Step Solution
There are 3 Steps involved in it

Get step-by-step solutions from verified subject matter experts