Question: Please include excel screenshot with formula view on The following dataset shows the monthly sales for three years. A) Plot the time series graph and

Please include excel screenshot with formula view onPlease include excel screenshot with formula view

The following dataset shows the monthly sales for three years. A) Plot the time series graph and discuss the possible time series components in the data. B) Use the exponential smoothing and forecast the sales for 2007M01. Date Counts 587 281 210 349 561 123 225 2004M01 2004M02 2004M03 2004M04 2004M05 2004M06 2004M07 2004M08 2004M09 2004M10 2004M11 2004M12 2005M01 2005M02 2005M03 2005M04 2005M05 2005M06 Date 2005M07 2005M08 2005M09 2005M10 2005M11 2005M12 2006M01 2006M02 2006M03 2006M04 2006M05 2006M06 2006M07 2006M08 2006M09 2006M10 2006M11 2006M12 Counts 231 299 403 632 759 848 561 268 212 331 542 128 225 304 416 642 769 853 572 301 273 208 341 553 136 389 624 748 842 The following dataset shows the monthly sales for three years. A) Plot the time series graph and discuss the possible time series components in the data. B) Use the exponential smoothing and forecast the sales for 2007M01. Date Counts 587 281 210 349 561 123 225 2004M01 2004M02 2004M03 2004M04 2004M05 2004M06 2004M07 2004M08 2004M09 2004M10 2004M11 2004M12 2005M01 2005M02 2005M03 2005M04 2005M05 2005M06 Date 2005M07 2005M08 2005M09 2005M10 2005M11 2005M12 2006M01 2006M02 2006M03 2006M04 2006M05 2006M06 2006M07 2006M08 2006M09 2006M10 2006M11 2006M12 Counts 231 299 403 632 759 848 561 268 212 331 542 128 225 304 416 642 769 853 572 301 273 208 341 553 136 389 624 748 842

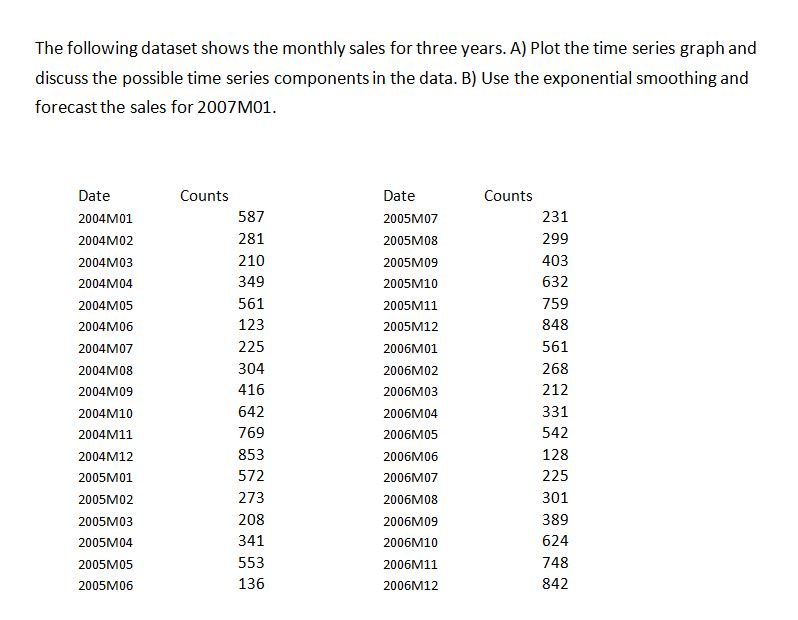
Step by Step Solution

There are 3 Steps involved in it

1 Expert Approved Answer
Step: 1 Unlock blur-text-image
Question Has Been Solved by an Expert!

Get step-by-step solutions from verified subject matter experts

Step: 2 Unlock
Step: 3 Unlock

Students Have Also Explored These Related General Management Questions!