

Question: Please include formulas Webmasters.com has developed a powerful new server that would be used for corporations' Internet activities. It would cost $10 million at Year
Please include formulas
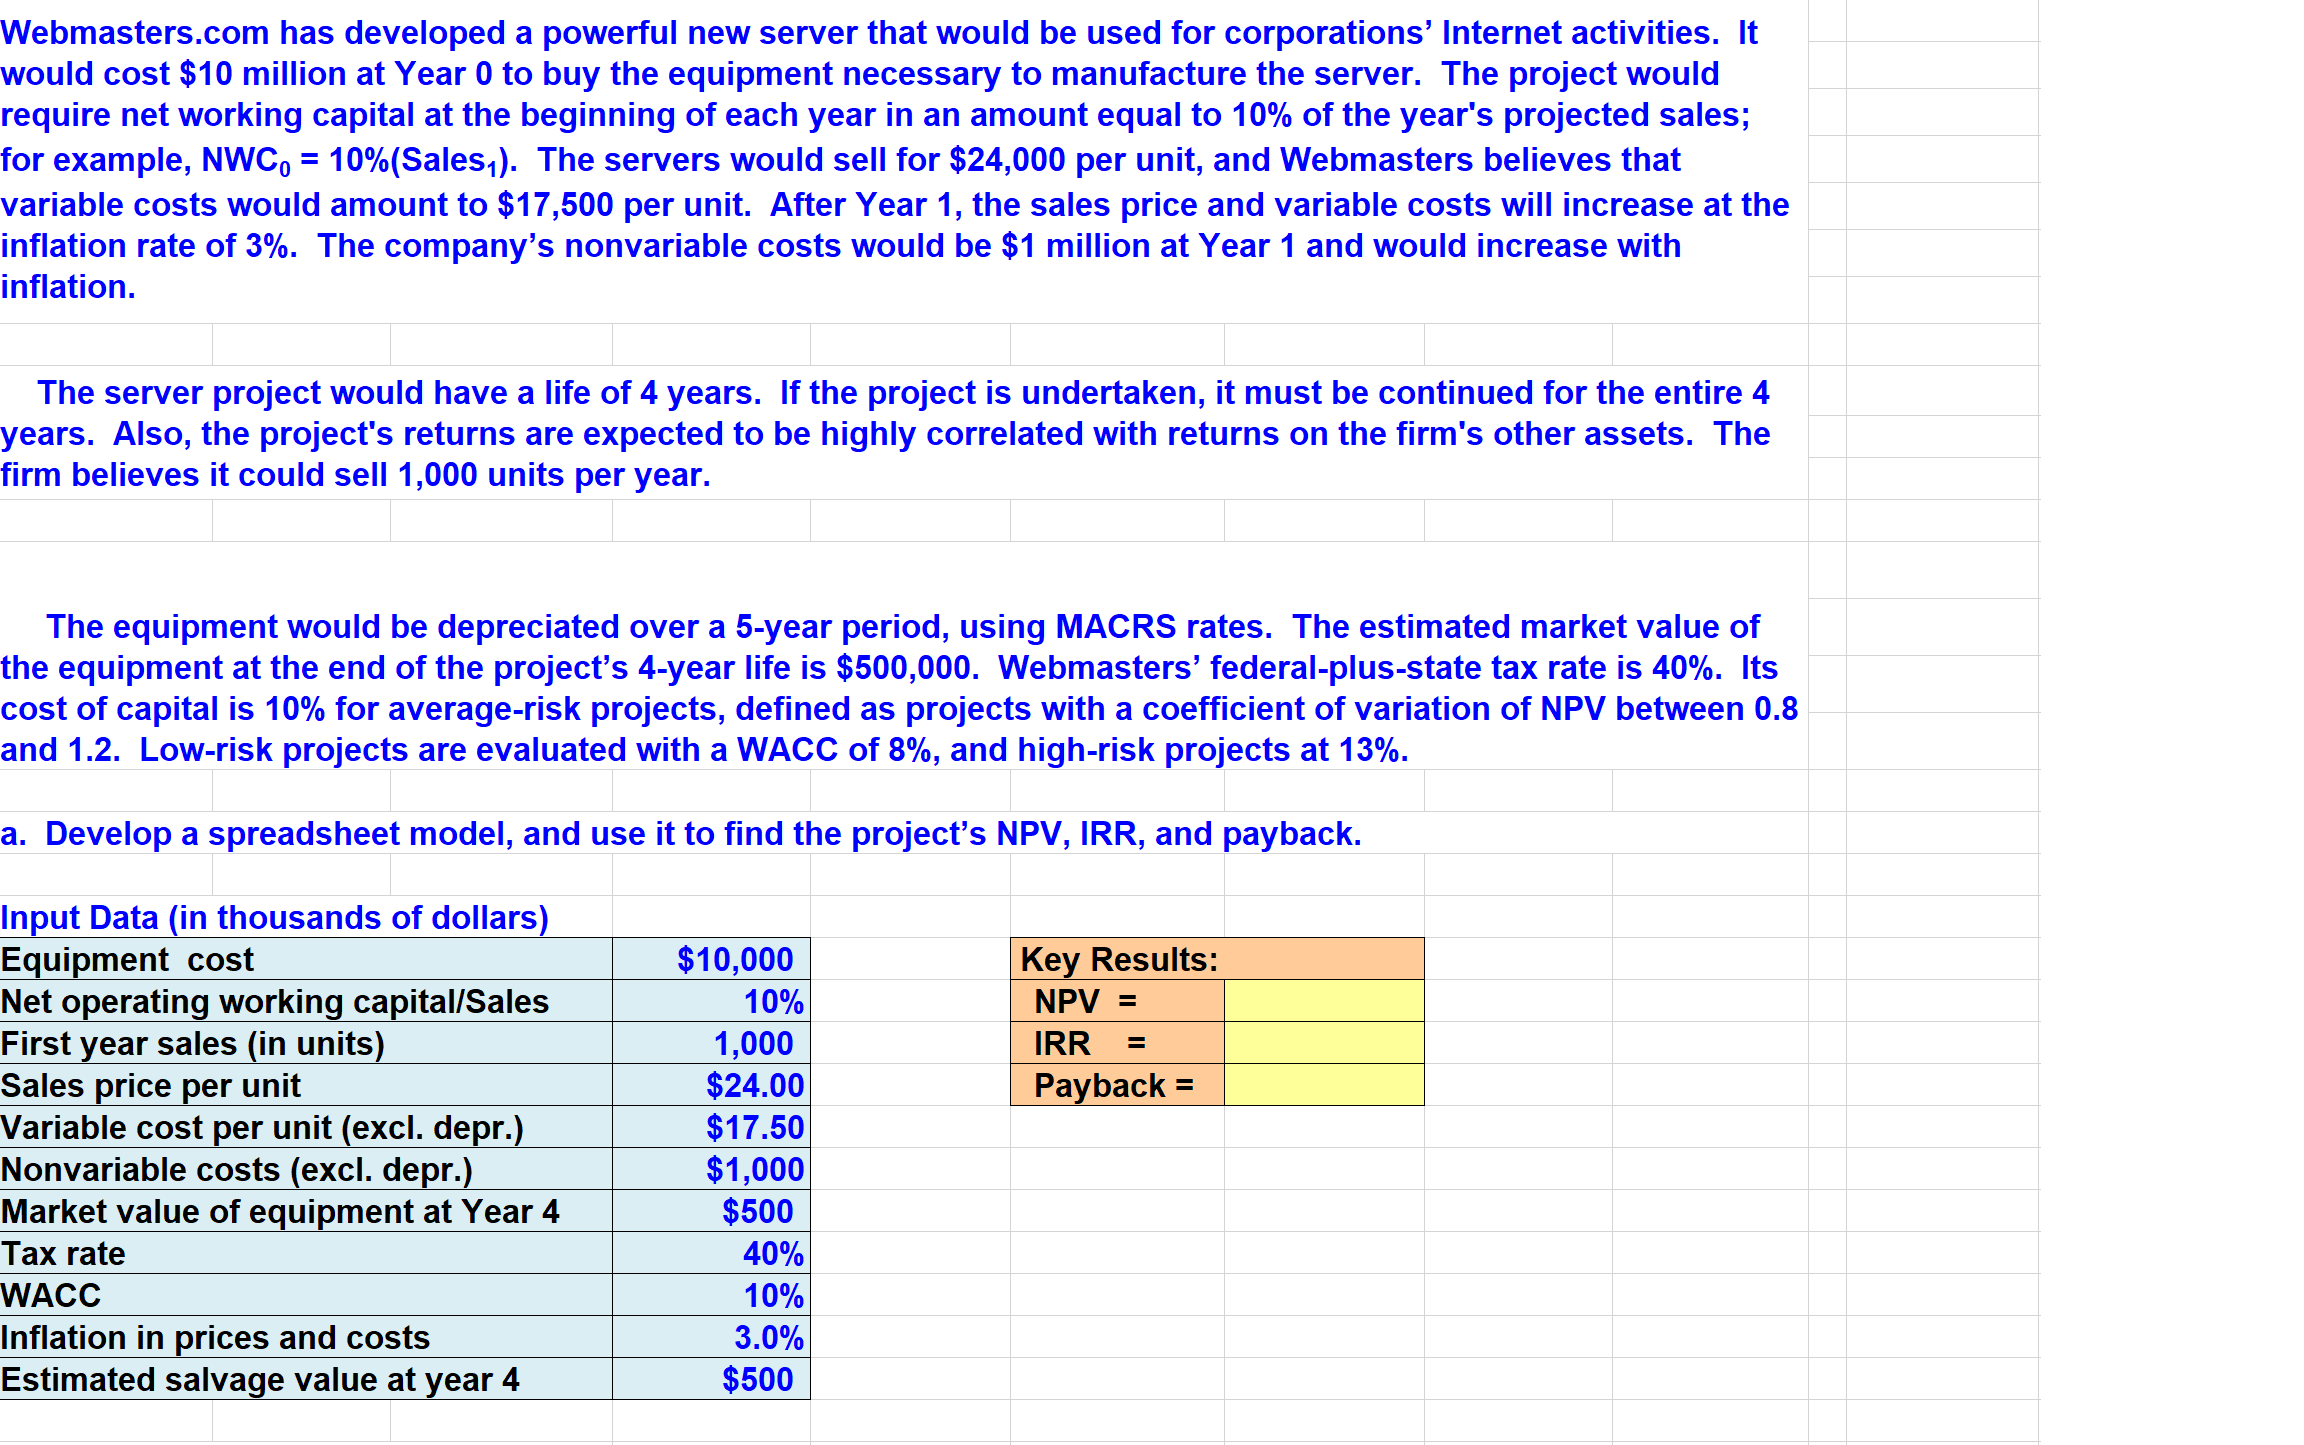
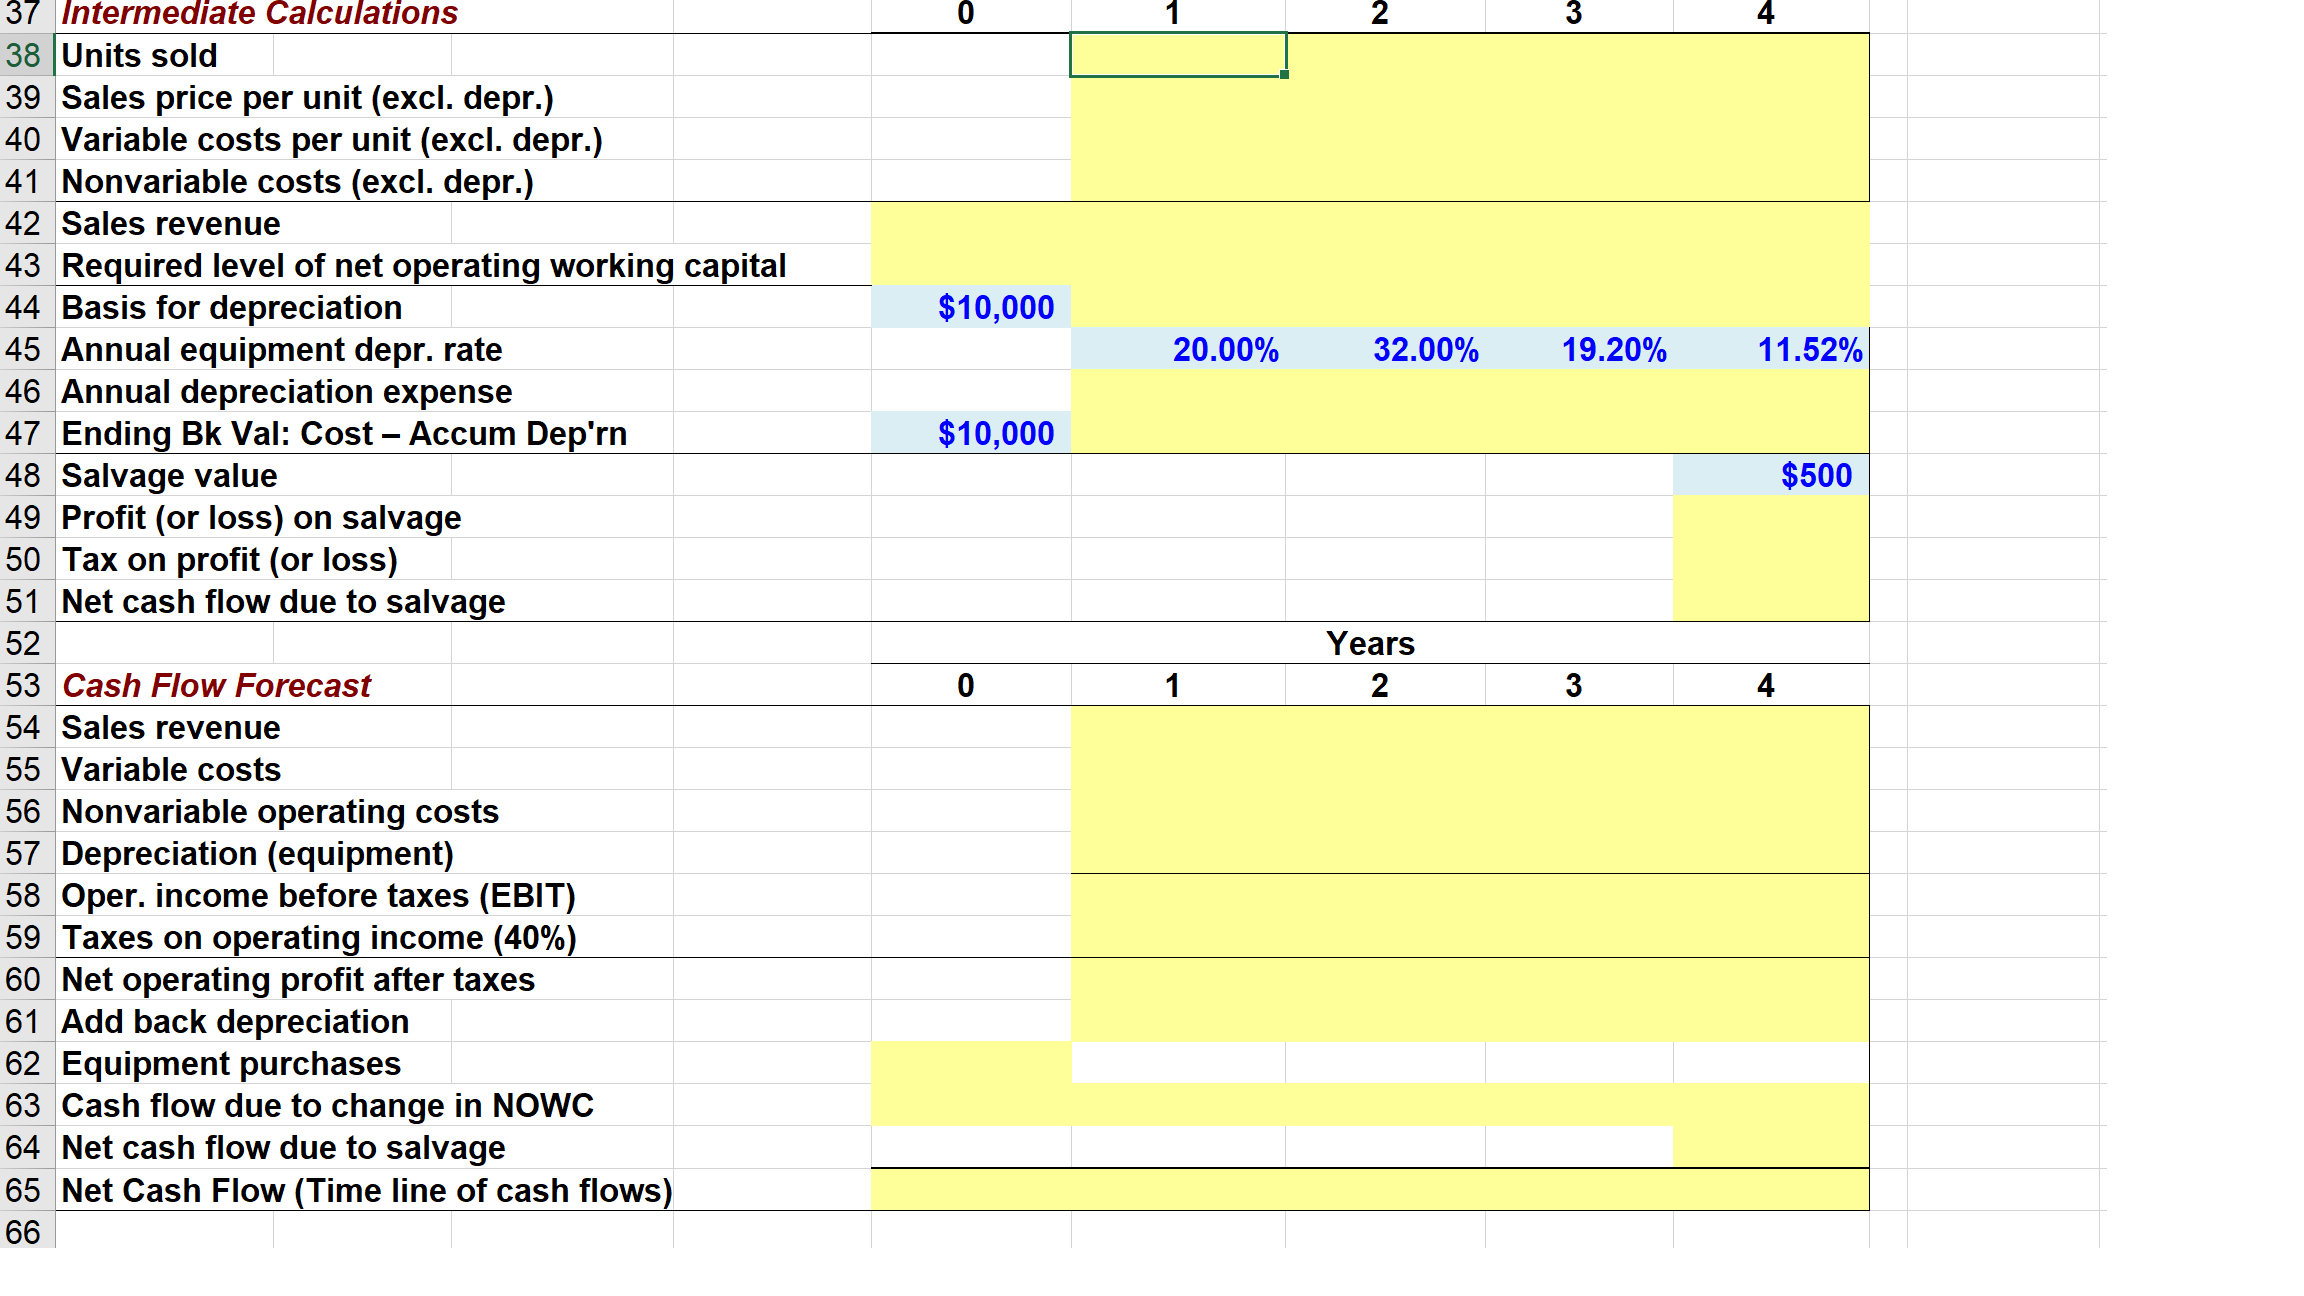
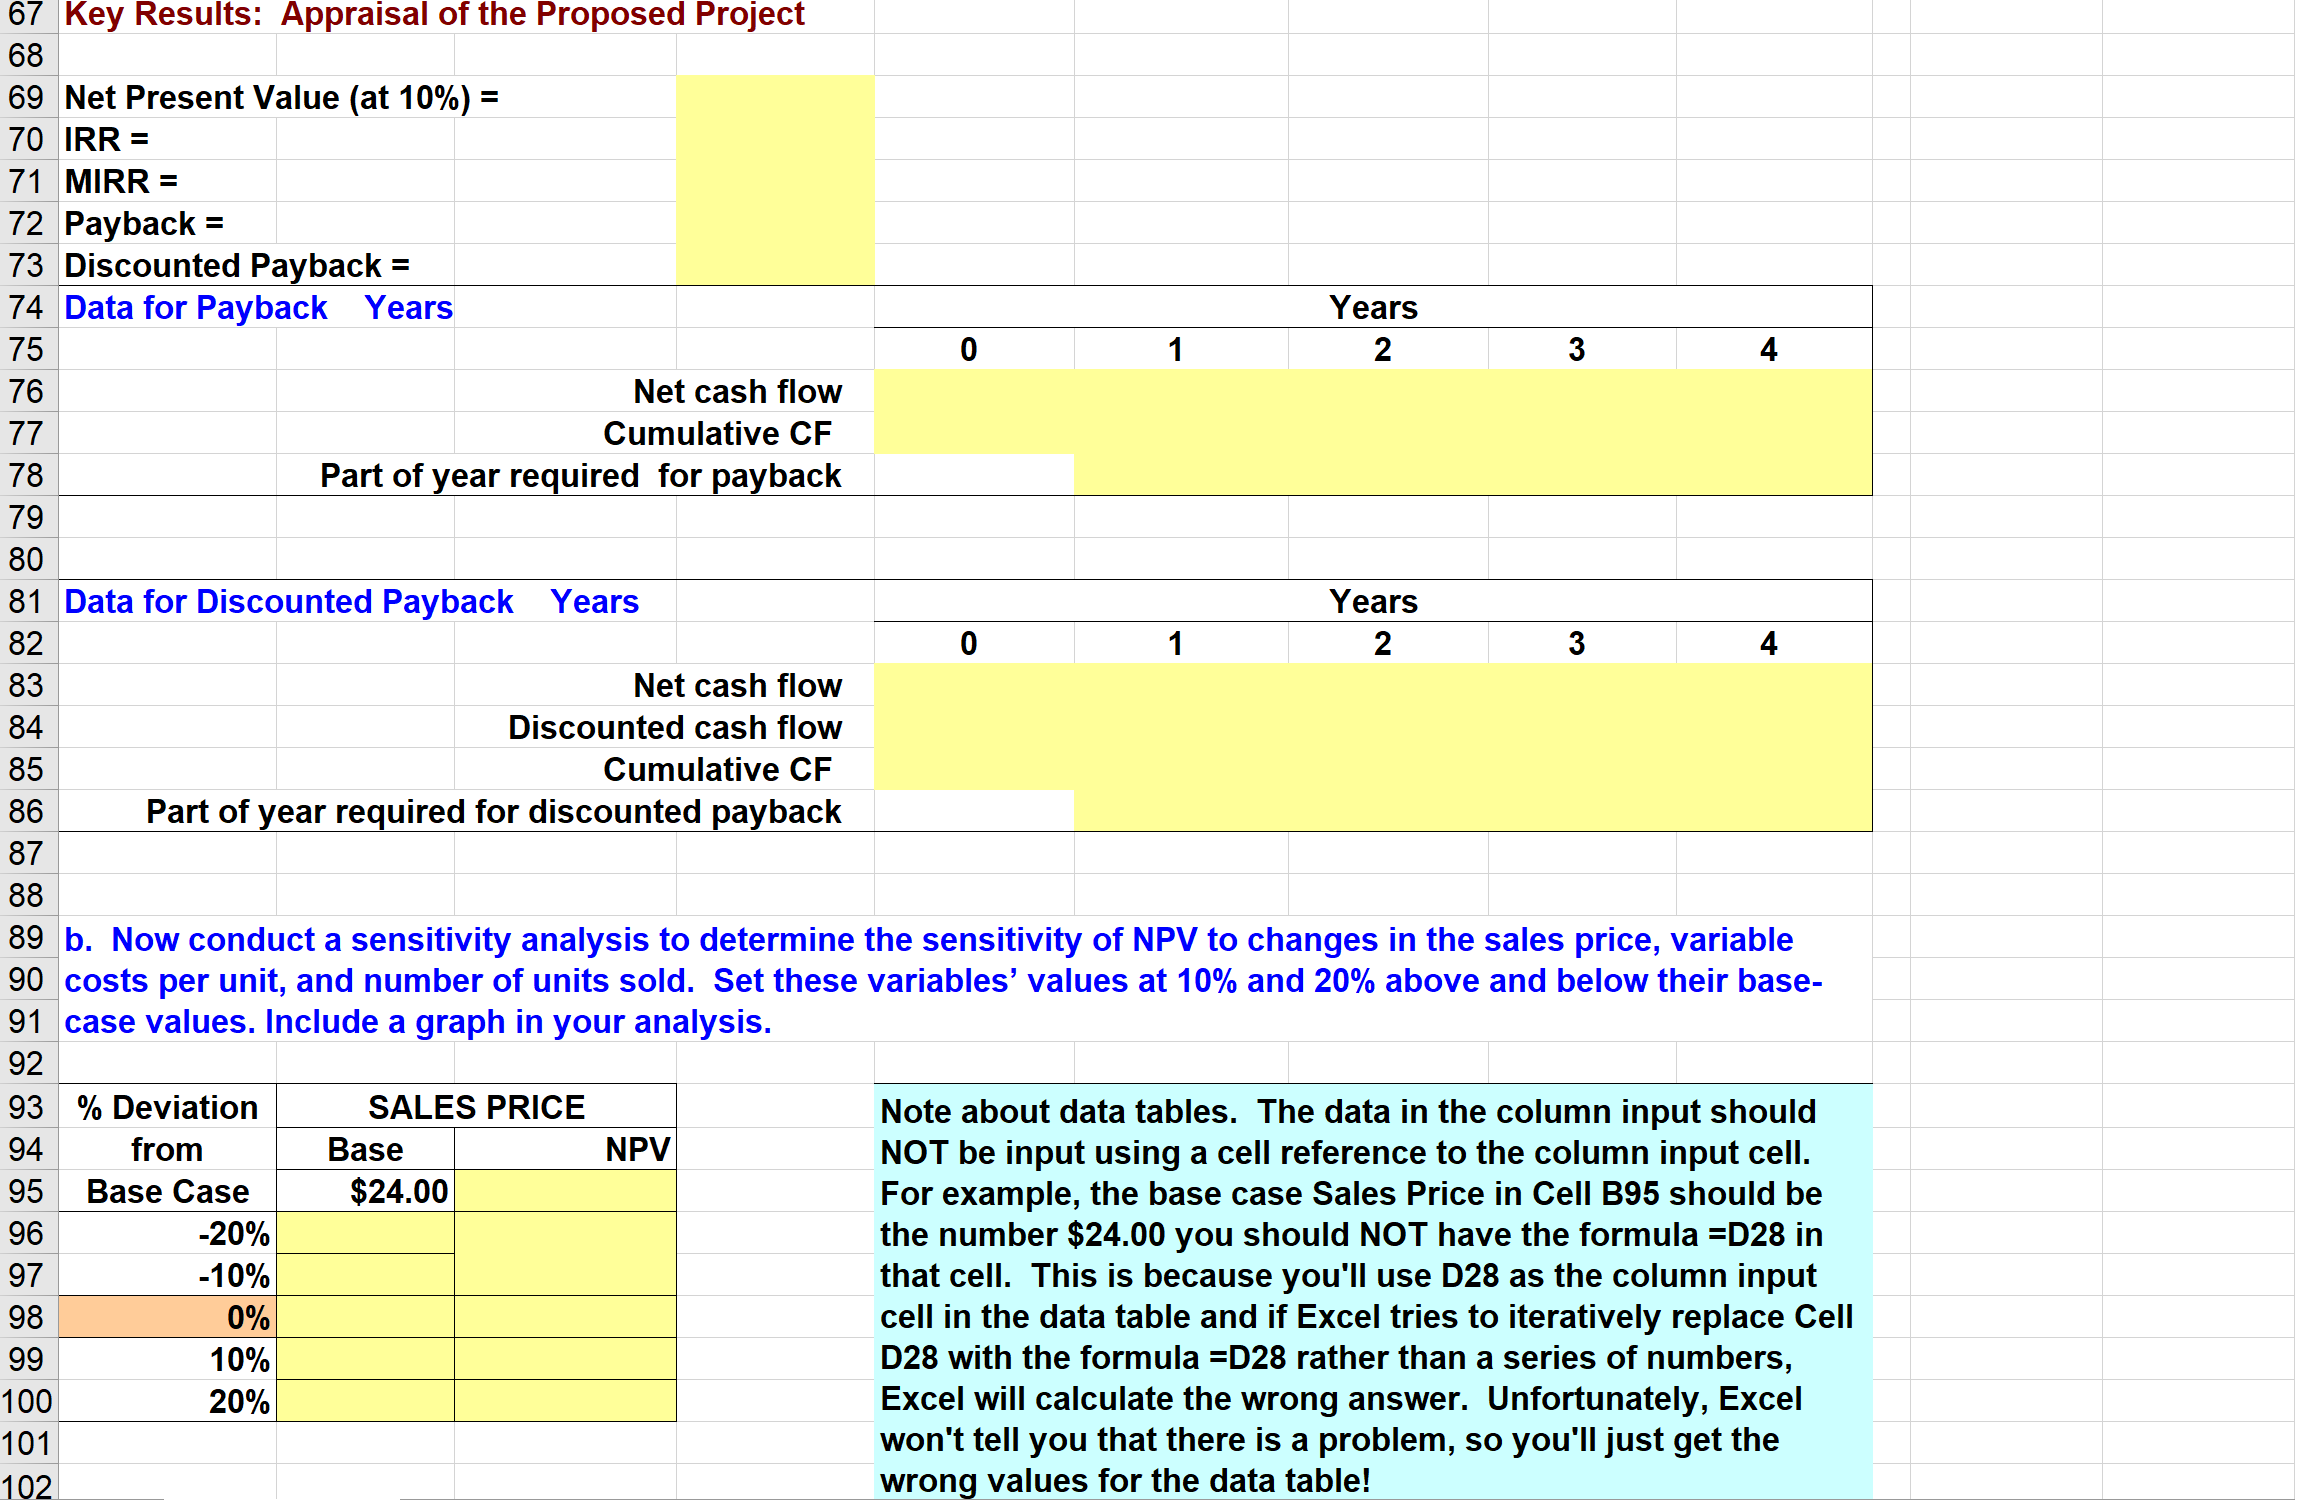
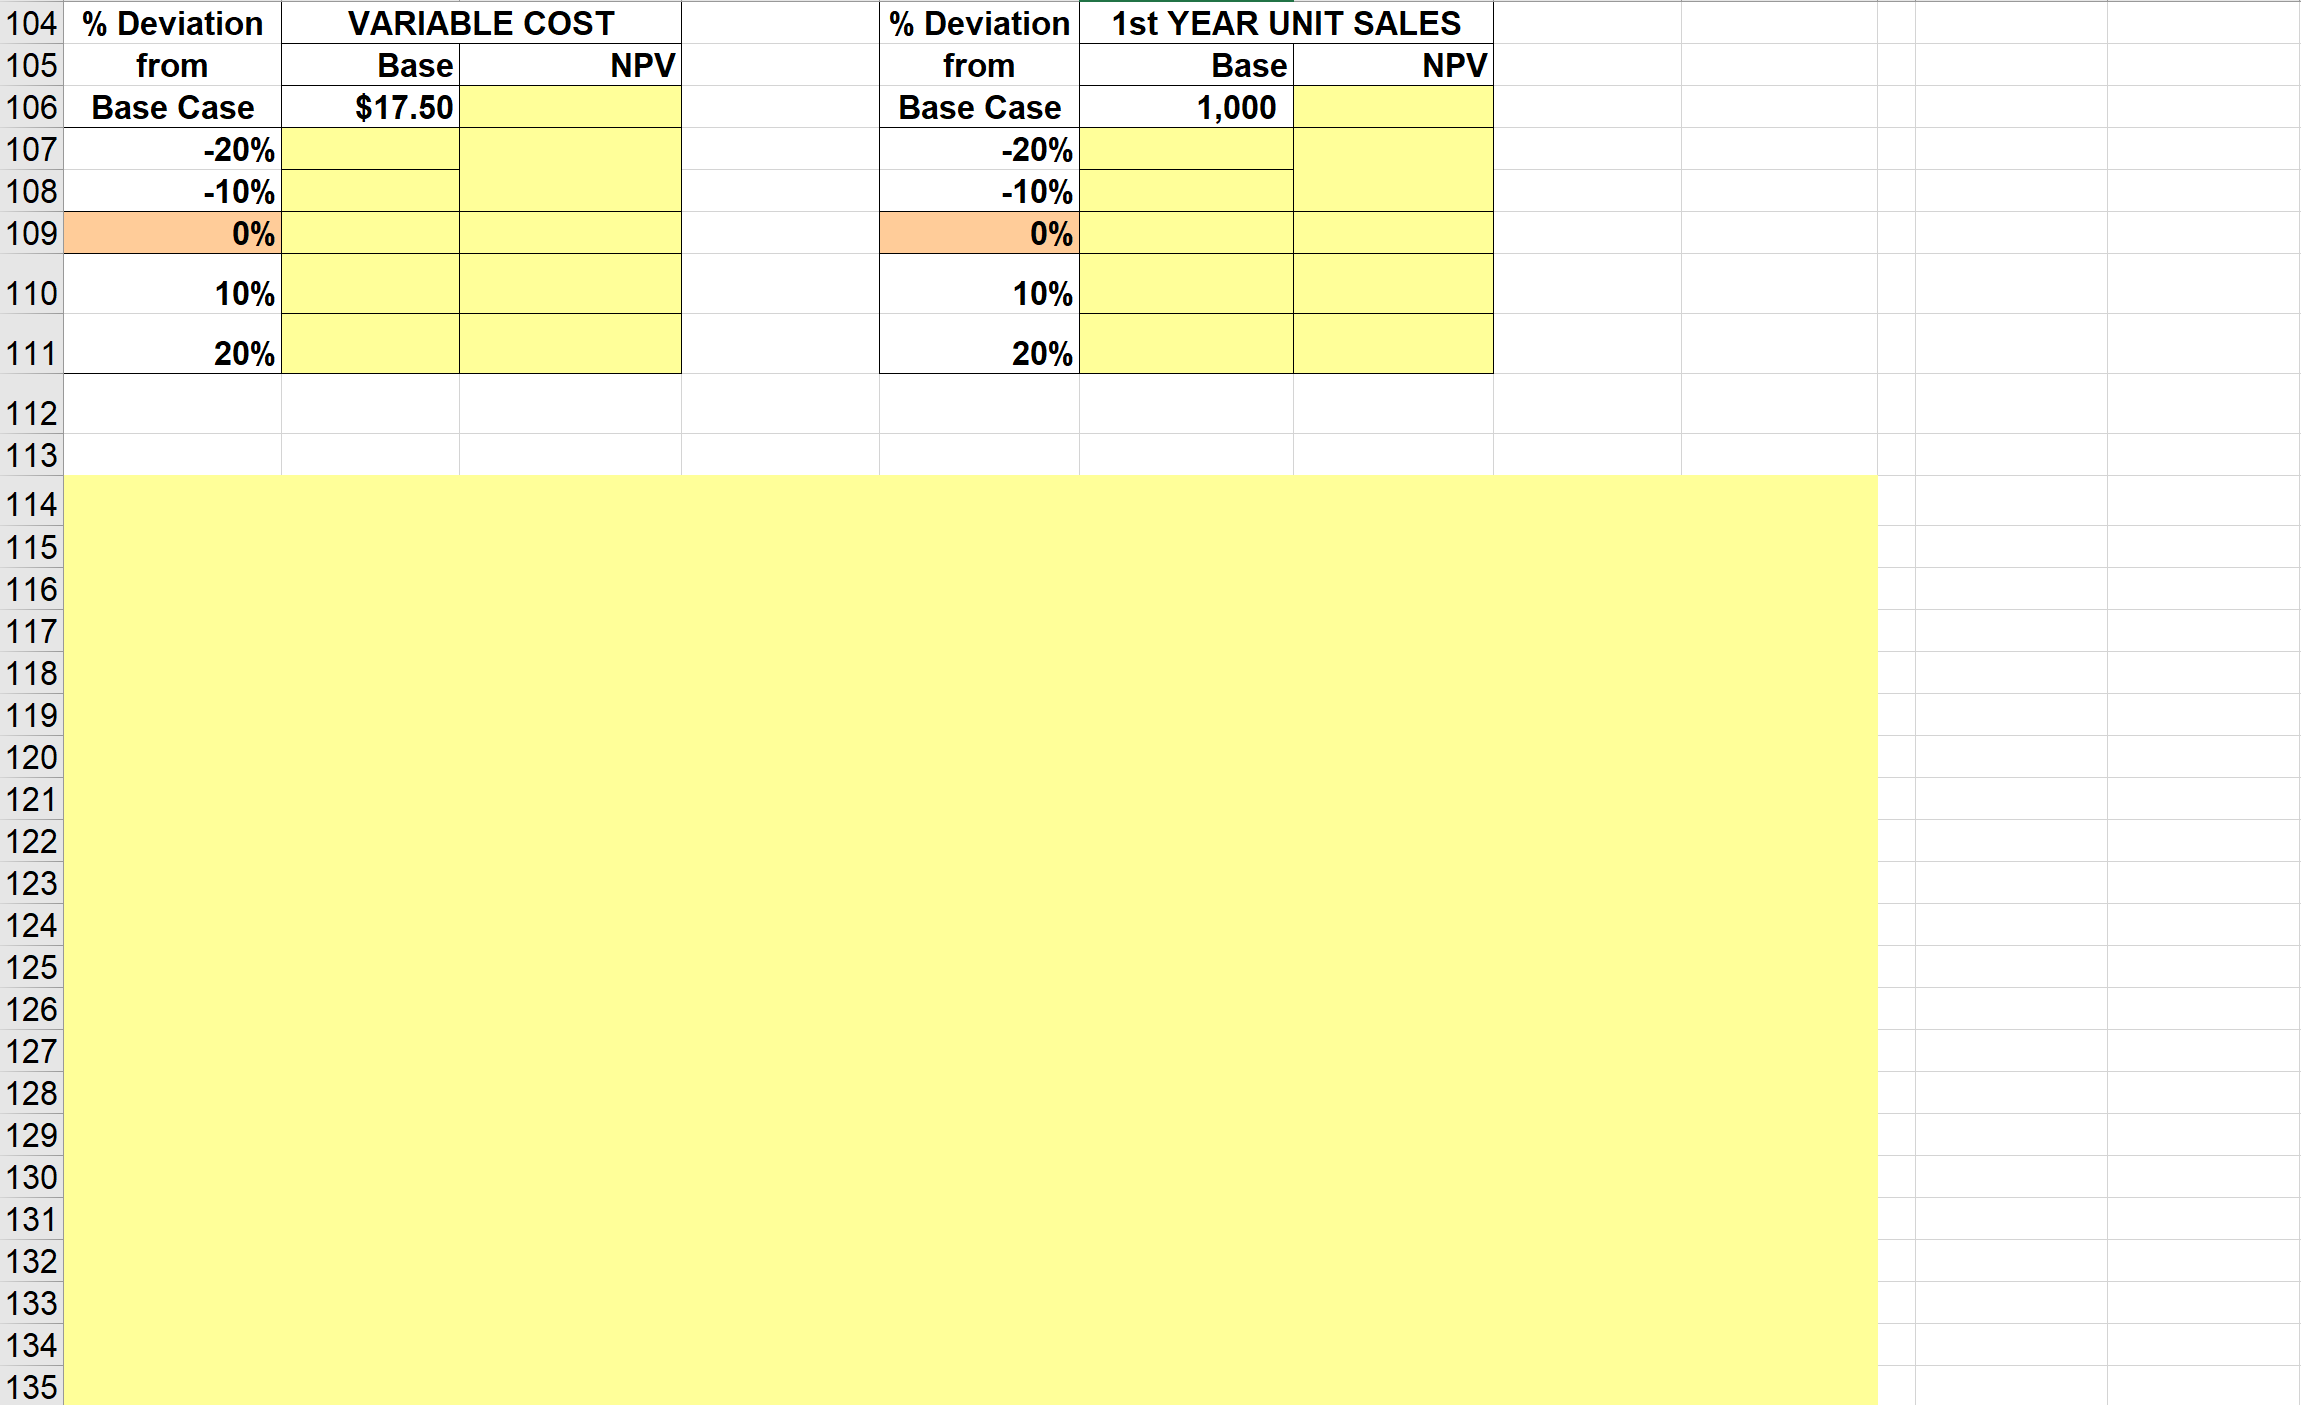
Webmasters.com has developed a powerful new server that would be used for corporations' Internet activities. It would cost $10 million at Year 0 to buy the equipment necessary to manufacture the server. The project would require net working capital at the beginning of each year in an amount equal to 10% of the year's projected sales; for example, NWC, = 10%(Sales). The servers would sell for $24,000 per unit, and Webmasters believes that variable costs would amount to $17,500 per unit. After Year 1, the sales price and variable costs will increase at the inflation rate of 3%. The company's nonvariable costs would be $1 million at Year 1 and would increase with inflation. The server project would have a life of 4 years. If the project is undertaken, it must be continued for the entire 4 years. Also, the project's returns are expected to be highly correlated with returns on the firm's other assets. The firm believes it could sell 1,000 units per year. The equipment would be depreciated over a 5-year period, using MACRS rates. The estimated market value of the equipment at the end of the project's 4-year life is $500,000. Webmasters' federal-plus-state tax rate is 40%. Its cost of capital is 10% for average-risk projects, defined as projects with a coefficient of variation of NPV between 0.8 and 1.2. Low-risk projects are evaluated with a WACC of 8%, and high-risk projects at 13%. a. Develop a spreadsheet model, and use it to find the project's NPV, IRR, and payback. Key Results: NPV = IRR Payback = Input Data (in thousands of dollars) Equipment cost Net operating working capital/Sales First year sales (in units) Sales price per unit Variable cost per unit (excl. depr.) Nonvariable costs (excl. depr.) Market value of equipment at Year 4 Tax rate WACC Inflation in prices and costs Estimated salvage value at year 4 $10,000 10% 1,000 $24.00 $17.50 $1,000 $500 40% 10% 3.0% $500 2 $10,000 20.00% 32.00% 19.20% 11.52% $10,000 $500 37 Intermediate Calculations 38 Units sold 39 Sales price per unit (excl. depr.) 40 Variable costs per unit (excl. depr.) 41 Nonvariable costs (excl. depr.). 42 Sales revenue 43 Required level of net operating working capital 44 Basis for depreciation 45 Annual equipment depr. rate 46 Annual depreciation expense 47 Ending Bk Val: Cost - Accum Dep'rn 48 Salvage value 49 Profit (or loss) on salvage 50 Tax on profit (or loss) 51 Net cash flow due to salvage 52 53 Cash Flow Forecast 54 Sales revenue 55 Variable costs 56 Nonvariable operating costs 57 Depreciation (equipment) 58 Oper. income before taxes (EBIT) 59 Taxes on operating income (40%) 60 Net operating profit after taxes 61 Add back depreciation 62 Equipment purchases 63 Cash flow due to change in NOWC 64 Net cash flow due to salvage 65 Net Cash Flow (Time line of cash flows) 66 Years 2 0 1 3 4 67 Key Results: Appraisal of the Proposed Project 68 69 Net Present Value (at 10%) = 70 IRR = 71 MIRR 72 Payback 73 Discounted Payback 74 Data for Payback Years 75 76 Net cash flow 77 Cumulative CF 78 Part of year required for payback Years 2 0 1 3 4 79 80 81 Data for Discounted Payback Years Years 82 0 1 2 3 4 83 Net cash flow 84 Discounted cash flow 85 Cumulative CF 86 Part of year required for discounted payback 87 88 89 b. Now conduct a sensitivity analysis to determine the sensitivity of NPV to changes in the sales price, variable 90 costs per unit, and number of units sold. Set these variables' values at 10% and 20% above and below their base- 91 case values. Include a graph in your analysis. 92 93 % Deviation SALES PRICE Note about data tables. The data in the column input should 94 from Base NPV NOT be input using a cell reference to the column input cell. 95 Base Case $24.00 For example, the base case Sales Price in Cell B95 should be -20% the number $24.00 you should NOT have the formula =D28 in 97 -10% that cell. This is because you'll use D28 as the column input 98 0% cell in the data table and if Excel tries to iteratively replace Cell 99 10% D28 with the formula =D28 rather than a series of numbers, 100 20% Excel will calculate the wrong answer. Unfortunately, Excel 101 won't tell you that there is a problem, so you'll just get the 102 wrong values for the data table! 96 VARIABLE COST Base NPV $17.50 1st YEAR UNIT SALES Base NPV 1,000 104 % Deviation 105 from 106 Base Case 107 -20% 108 -10% 109 0% % Deviation from Base Case -20% -10% 0% 110 10% 10% 111 20% 20% 112 113 114 115 116 117 118 119 120 121 122 123 124 125 126 127 128 129 130 131 132 133 134 135 $0 136 137 138 139 140 141 142 143 144 145 146 147 Deviation NPV at Different Deviations from Base from Sales Variable Base Case Price Cost/Unit Units Sold -20% $0 -10% $0 $0 $0 0% $0 $0 $0 10% $0 $0 $0 20% $0 $0 $0 $0 Range 148 c. Now conduct a scenario analysis. Assume that there is a 25% probability that best-case conditions, with each of 149 the variables discussed in Part b being 20% better than its base-case value, will occur. There is a 25% probability of worst-case conditions, with the variables 20% worse than base, and a 50% probability of base-case conditions. 150 151 152 153 154 Sales Unit Variable 155 Scenario Probability Price Sales Costs NPV 156 157 Best Case 25% $28.80 1,200 $14.00 158 Base Case 50% $24.00 1,000 $17.50 159 Worst Case 25% $19.20 800 $21.00 160 161 Expected NPV = 162 Standard Deviation = 163 Coefficient of Variation = Std Dev / Expected NPV = 164 165 d. If the project appears to be more or less risky than an average project, find its risk-adjusted NPV, IRR, and 166 payback. 167 168 CV range of firm's average-risk project: 0.8 to 1.2 169 Low-risk WACC = 8% 170 WACC 10% 171 High-risk WACC = 13% 172 173 Risk-adjusted WACC = 174 Risk adjusted NPV = 175 IRR 176 Payback 177 178 e. On the basis of information in the problem, would you recommend that the project be accepted? 179 = 180 81 82 183 184 185 186 187 188 189 190 191 192 103 Webmasters.com has developed a powerful new server that would be used for corporations' Internet activities. It would cost $10 million at Year 0 to buy the equipment necessary to manufacture the server. The project would require net working capital at the beginning of each year in an amount equal to 10% of the year's projected sales; for example, NWC, = 10%(Sales). The servers would sell for $24,000 per unit, and Webmasters believes that variable costs would amount to $17,500 per unit. After Year 1, the sales price and variable costs will increase at the inflation rate of 3%. The company's nonvariable costs would be $1 million at Year 1 and would increase with inflation. The server project would have a life of 4 years. If the project is undertaken, it must be continued for the entire 4 years. Also, the project's returns are expected to be highly correlated with returns on the firm's other assets. The firm believes it could sell 1,000 units per year. The equipment would be depreciated over a 5-year period, using MACRS rates. The estimated market value of the equipment at the end of the project's 4-year life is $500,000. Webmasters' federal-plus-state tax rate is 40%. Its cost of capital is 10% for average-risk projects, defined as projects with a coefficient of variation of NPV between 0.8 and 1.2. Low-risk projects are evaluated with a WACC of 8%, and high-risk projects at 13%. a. Develop a spreadsheet model, and use it to find the project's NPV, IRR, and payback. Key Results: NPV = IRR Payback = Input Data (in thousands of dollars) Equipment cost Net operating working capital/Sales First year sales (in units) Sales price per unit Variable cost per unit (excl. depr.) Nonvariable costs (excl. depr.) Market value of equipment at Year 4 Tax rate WACC Inflation in prices and costs Estimated salvage value at year 4 $10,000 10% 1,000 $24.00 $17.50 $1,000 $500 40% 10% 3.0% $500 2 $10,000 20.00% 32.00% 19.20% 11.52% $10,000 $500 37 Intermediate Calculations 38 Units sold 39 Sales price per unit (excl. depr.) 40 Variable costs per unit (excl. depr.) 41 Nonvariable costs (excl. depr.). 42 Sales revenue 43 Required level of net operating working capital 44 Basis for depreciation 45 Annual equipment depr. rate 46 Annual depreciation expense 47 Ending Bk Val: Cost - Accum Dep'rn 48 Salvage value 49 Profit (or loss) on salvage 50 Tax on profit (or loss) 51 Net cash flow due to salvage 52 53 Cash Flow Forecast 54 Sales revenue 55 Variable costs 56 Nonvariable operating costs 57 Depreciation (equipment) 58 Oper. income before taxes (EBIT) 59 Taxes on operating income (40%) 60 Net operating profit after taxes 61 Add back depreciation 62 Equipment purchases 63 Cash flow due to change in NOWC 64 Net cash flow due to salvage 65 Net Cash Flow (Time line of cash flows) 66 Years 2 0 1 3 4 67 Key Results: Appraisal of the Proposed Project 68 69 Net Present Value (at 10%) = 70 IRR = 71 MIRR 72 Payback 73 Discounted Payback 74 Data for Payback Years 75 76 Net cash flow 77 Cumulative CF 78 Part of year required for payback Years 2 0 1 3 4 79 80 81 Data for Discounted Payback Years Years 82 0 1 2 3 4 83 Net cash flow 84 Discounted cash flow 85 Cumulative CF 86 Part of year required for discounted payback 87 88 89 b. Now conduct a sensitivity analysis to determine the sensitivity of NPV to changes in the sales price, variable 90 costs per unit, and number of units sold. Set these variables' values at 10% and 20% above and below their base- 91 case values. Include a graph in your analysis. 92 93 % Deviation SALES PRICE Note about data tables. The data in the column input should 94 from Base NPV NOT be input using a cell reference to the column input cell. 95 Base Case $24.00 For example, the base case Sales Price in Cell B95 should be -20% the number $24.00 you should NOT have the formula =D28 in 97 -10% that cell. This is because you'll use D28 as the column input 98 0% cell in the data table and if Excel tries to iteratively replace Cell 99 10% D28 with the formula =D28 rather than a series of numbers, 100 20% Excel will calculate the wrong answer. Unfortunately, Excel 101 won't tell you that there is a problem, so you'll just get the 102 wrong values for the data table! 96 VARIABLE COST Base NPV $17.50 1st YEAR UNIT SALES Base NPV 1,000 104 % Deviation 105 from 106 Base Case 107 -20% 108 -10% 109 0% % Deviation from Base Case -20% -10% 0% 110 10% 10% 111 20% 20% 112 113 114 115 116 117 118 119 120 121 122 123 124 125 126 127 128 129 130 131 132 133 134 135 $0 136 137 138 139 140 141 142 143 144 145 146 147 Deviation NPV at Different Deviations from Base from Sales Variable Base Case Price Cost/Unit Units Sold -20% $0 -10% $0 $0 $0 0% $0 $0 $0 10% $0 $0 $0 20% $0 $0 $0 $0 Range 148 c. Now conduct a scenario analysis. Assume that there is a 25% probability that best-case conditions, with each of 149 the variables discussed in Part b being 20% better than its base-case value, will occur. There is a 25% probability of worst-case conditions, with the variables 20% worse than base, and a 50% probability of base-case conditions. 150 151 152 153 154 Sales Unit Variable 155 Scenario Probability Price Sales Costs NPV 156 157 Best Case 25% $28.80 1,200 $14.00 158 Base Case 50% $24.00 1,000 $17.50 159 Worst Case 25% $19.20 800 $21.00 160 161 Expected NPV = 162 Standard Deviation = 163 Coefficient of Variation = Std Dev / Expected NPV = 164 165 d. If the project appears to be more or less risky than an average project, find its risk-adjusted NPV, IRR, and 166 payback. 167 168 CV range of firm's average-risk project: 0.8 to 1.2 169 Low-risk WACC = 8% 170 WACC 10% 171 High-risk WACC = 13% 172 173 Risk-adjusted WACC = 174 Risk adjusted NPV = 175 IRR 176 Payback 177 178 e. On the basis of information in the problem, would you recommend that the project be accepted? 179 = 180 81 82 183 184 185 186 187 188 189 190 191 192 103
Step by Step Solution
There are 3 Steps involved in it

Get step-by-step solutions from verified subject matter experts