

Question: please include graph 7. complete the following table for your experimental runs to deterimina wha srthisisw and. in remperature values come from run 3 in
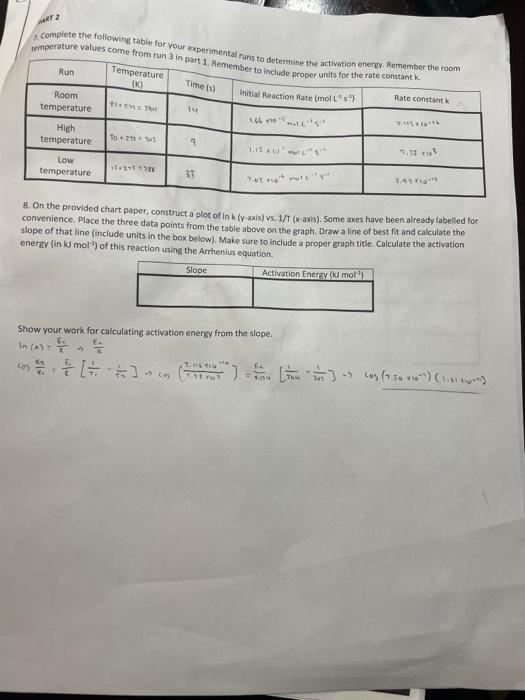
7. complete the following table for your experimental runs to deterimina wha srthisisw and. in remperature values come from run 3 in part 1 . 8. On the proyided chart paper, construct a plot of In k (y-axis) vs. 1/T (x-axis). Some axes have been already labelsed for convenience. Place the three data points from the table above on the graph. Draw a line of best fit and calculate the slope of that line (include units in the box below). Make sure to include a proper graph title. Calculate the activation energy (in kJmol1 ) of this reaction using the Arthenius equation. Show your work for calculating activation energy from the slope. ln(A)=RF0ir 7. complete the following table for your experimental runs to deterimina wha srthisisw and. in remperature values come from run 3 in part 1 . 8. On the proyided chart paper, construct a plot of In k (y-axis) vs. 1/T (x-axis). Some axes have been already labelsed for convenience. Place the three data points from the table above on the graph. Draw a line of best fit and calculate the slope of that line (include units in the box below). Make sure to include a proper graph title. Calculate the activation energy (in kJmol1 ) of this reaction using the Arthenius equation. Show your work for calculating activation energy from the slope. ln(A)=RF0ir
Step by Step Solution
There are 3 Steps involved in it

Get step-by-step solutions from verified subject matter experts