

Question: Please include graphs in your answer, thank you! Where Y is output and Pi is inflation and PI* is central bank desired inflation and e
Please include graphs in your answer, thank you! Where Y is output and Pi is inflation and PI* is central bank desired inflation and e and v are some shocks, please calculate the value of the shock (e or v) as a result of a 2% growth in inflation. Then please explain the affects of the shock graphically
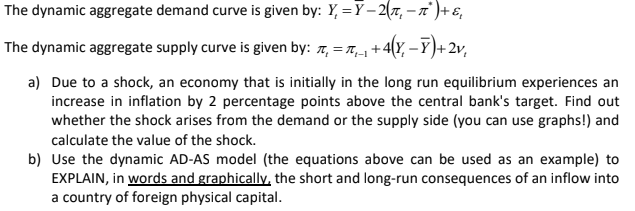
The dynamic aggregate demand curve is given by: Y=Y-27 ) + The dynamic aggregate supply curve is given by: =_, +4(YY) + 2v a) Due to a shock, an economy that is initially in the long run equilibrium experiences an increase in inflation by 2 percentage points above the central bank's target. Find out whether the shock arises from the demand or the supply side (you can use graphs!) and calculate the value of the shock. b) Use the dynamic AD-AS model (the equations above can be used as an example) to EXPLAIN, in words and graphically, the short and long-run consequences of an inflow into a country of foreign physical capital. The dynamic aggregate demand curve is given by: Y=Y-27 ) + The dynamic aggregate supply curve is given by: =_, +4(YY) + 2v a) Due to a shock, an economy that is initially in the long run equilibrium experiences an increase in inflation by 2 percentage points above the central bank's target. Find out whether the shock arises from the demand or the supply side (you can use graphs!) and calculate the value of the shock. b) Use the dynamic AD-AS model (the equations above can be used as an example) to EXPLAIN, in words and graphically, the short and long-run consequences of an inflow into a country of foreign physical capital
Step by Step Solution
There are 3 Steps involved in it

Get step-by-step solutions from verified subject matter experts