

Question: Please include matlab code 1. The army is interested in characterizing the scoustic signature of a helioopter. The following data show measurements of scoustic pressure
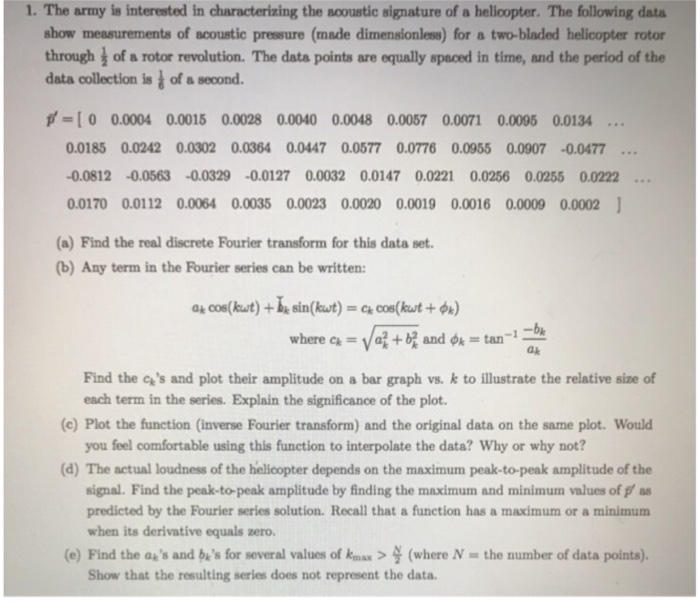
1. The army is interested in characterizing the scoustic signature of a helioopter. The following data show measurements of scoustic pressure (made dimensionless) for a two-bladed helicopter rotor through of a rotor revolution. The data points are equally spaced in time, and the period of the data collection is of a second. p'-:[ 0 0.0004 0.0015 0.0028 0.0040 0.0048 0.0057 0.0071 0.0095 0.0134 0.0185 0.0242 0.0302 0.0364 0.0447 0.0577 0.0776 0.0955 0.0907 -0.0477 .. 0.0812 -0.0563 -0.0329 -0.0127 0.0032 0.0147 0.0221 0.0256 0.0255 0.0222 0.0170 0.0112 0.0064 0.0035 0.0023 0.0020 0.0019 0.0016 0.0009 0.0002 (a) Find the real discrete Fourier transform for this data set. b) Any term in the Fourier series can be written: here a-H+4 and 4-tan-14 Find the c's and plot their amplitude on a bar graph vs. k to illustrate the relative size of each term in the series. Explain the significance of the plot. (c) Plot the function (inverse Fourier transform) and the original data on the same plot. Would you feel comfortable using this function to interpolate the data? Why or why not? (d) The actual loudness of the helicopter depends on the maximum peak-to-peak amplitude of the signal. Find the peak-to-peak amplitude by finding the maximum and minimum values of f as predicted by the Fourier series solution. Recall that a function has a maximum or a minimum when its derivative equals zero. (e) Find the au's and bu's for several values of ax(where N the number of data points). Show that the resulting series does not represent the data
Step by Step Solution
There are 3 Steps involved in it

Get step-by-step solutions from verified subject matter experts