

Question: Please include steps and formulas used to complete this task. Thank you! Apple, Inc. is one of the most successful companies in the world. The
Please include steps and formulas used to complete this task. Thank you!
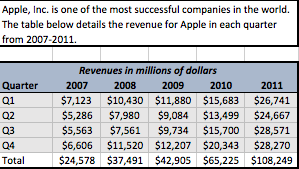
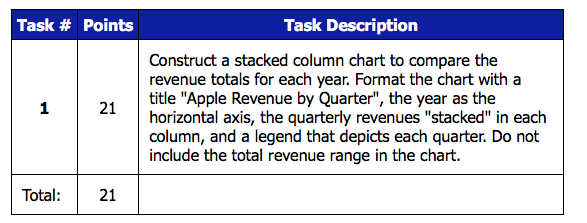
Apple, Inc. is one of the most successful companies in the world. The table below details the revenue for Apple in each quarter from 2007-2011 Revenues in millions of dollars 2007 $7,123 $10,430 $11,880 $15,683 $26,741 $5,286 $7,980 $9,084 $13,499 $24,667 $5,563 $7,561 $9,734 $15,700 $28,571 $6,606 $11,520 $12,207 $20,343 $28,270 $24,578 $37,491 $42,905 $65,225 $108,249 2009 Quarter Q1 02 03 Q4 Total 2008 2010 2011 Task # Points Task Description Construct a stacked column chart to compare the revenue totals for each year. Format the chart with a title "Apple Revenue by Quarter", the year as the horizontal axis, the quarterly revenues "stacked" in each 1 21 include the total revenue range in the chart. Total: 21 Apple, Inc. is one of the most successful companies in the world. The table below details the revenue for Apple in each quarter from 2007-2011 Revenues in millions of dollars 2007 $7,123 $10,430 $11,880 $15,683 $26,741 $5,286 $7,980 $9,084 $13,499 $24,667 $5,563 $7,561 $9,734 $15,700 $28,571 $6,606 $11,520 $12,207 $20,343 $28,270 $24,578 $37,491 $42,905 $65,225 $108,249 2009 Quarter Q1 02 03 Q4 Total 2008 2010 2011 Task # Points Task Description Construct a stacked column chart to compare the revenue totals for each year. Format the chart with a title "Apple Revenue by Quarter", the year as the horizontal axis, the quarterly revenues "stacked" in each 1 21 include the total revenue range in the chart. Total: 21
Step by Step Solution
There are 3 Steps involved in it

Get step-by-step solutions from verified subject matter experts