

Question: Please include the cell reference used to fill in the chart in the 2nd picture. I really just need to know what cells to use
Please include the cell reference used to fill in the chart in the 2nd picture. I really just need to know what cells to use for the calculations, so if you don't want to remake the whole excel spreadsheet just post what formulas I used with the cell references.
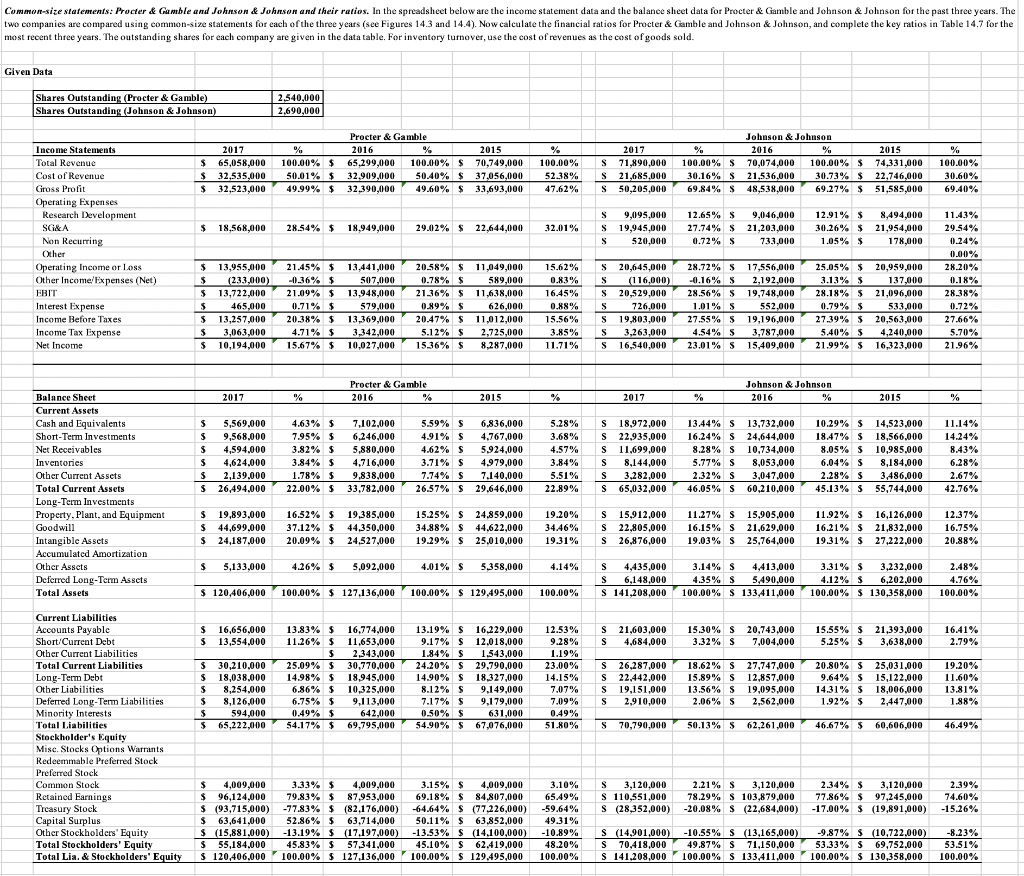
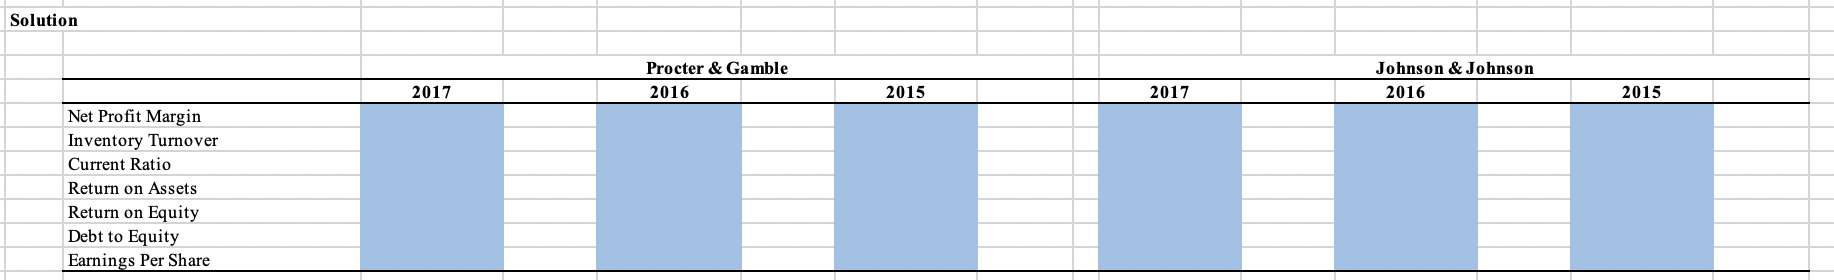
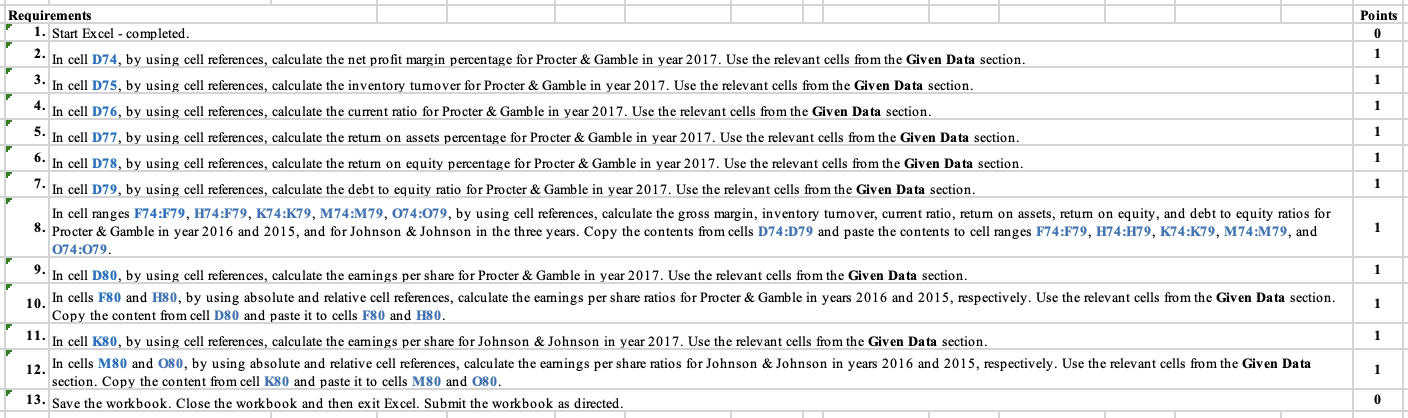
Common-size statements: Procter & Gamble and Johnson & Johnson and their ratios. In the spreadsheet below are the income statement data and the balance sheet data for Procter & Gamble and Johnson & Johnson for the past three years. The two companies are compared using common-size statements for each of the three years (see Figures 14.3 and 14.4). Now calculate the financial ratios for Procter & Gamble and Johnson & Johnson, and complete the key ratios in Table 14.7 for the most recent three years. The outstanding shares for each company are given in the data table. For inventory turnover, use the cost of revenues as the cost of goods sold. Given Data Shares Outstanding (Procter & Gamble) Shares Outstanding Johnson & Johnson) 2.540,000 2.690,000 2017 $ 65,058.000 S 32,535,000 $ 32,523,000 % 100.00% $ 50.01% $ 49.99% Procter & Gamble 2016 % 65.299,000 100.00% $ 32.909,000 50.40% $ 32,390,000 49.60% S 2015 70,749,000 37,056,000 33.693,000 % 100.00% 52.38% 47.62% 2017 S 71.890,000 S 21,685,000 S 50,205,000 Johnson & Johnson % 2016 % 2015 100.00% $ 70,074,000 100.00% $ 74,331,000 30.16% $ 21,536,000 30.73% $ 22,746,000 69.84% $ 48,538,000 69.27% S 51,585,000 % 100.00% 30.60% 69.40% S S 18,568,000 28.54% 18.949,000 29.02% $ 22,644,000 32.01% S 9,095,000 19,945,000 520.000 12.65% S 27.74% 0.72% 9,046,000 21,203,000 733,000 12.91% $ 30.26% $ 1.05% $ 8,494,000 21,954,000 178,000 S Income Statements Total Revenue Cost of Revenue Gross Profit Operating Expenses Research Development SG&A A Non Recurring Other Operating Income or Loss Other Income/Expenses (Net) EBIT Interest Expense Income Before Taxes Income Tax Expense Net Income $ 13,955,000 $ (23.3.000) $ 13,722.000 $ 465,000 $ 13,257,000 $ 3,063,000 $ 10,194,000 21.45% $ -0.36% $ 21.09% S 0.71% $ 20.38% $ 4.71% $ 15.67% $ 13,441,000 507,000 13,948,000 579,000 13,369,000 3,342,000 10,027,000 20.58% $ 11,049,000 0.78% $ 589,000 21.36% $ 11,638,000 0.89% 626,000 20.47% 11,012.000 5.12% $ 2,725,000 15.36% $ 8,287,000 15.62% 0.83% 16.45% 0.88% 15.56% 3.85% 11.71% S 20,645,000 S (116,000) S 20,529,000 S 726,000 S 19.803,000 S 3,263,000 S 16,540,000 28.72% $ 17,556,000 -0.16% S 2,192,000 28.56% 19,748.000 1.01% 552,000 27.55% S 19,196,000 4.54% 5 3,787,000 23.01% $ 15,409,000 25.05% 5 3.13% $ 28.18% $ 0.79% 27.39% $ 5.40% $ 21.99% $ 20,959,000 137,000 21,096,000 533,000 20,563,000 4,240,000 16,323,000 11.43% 29.54% 0.24% 0.00% 28.20% 0.18% 28.38% 0.72% 27.66% 5.70% % 21.96% Procter & Gamble 2016 % Johnson & Johnson 2016 2017 % 2015 % 2017 2015 % s 5,569.000 $ 9,568,000 $ 4,594.000 S 4,624,000 s 2,139,000 $ 26,494,000 4.63% 5 7.95% $ 3.82% 5 3.84% 5 1.78% $ 22.00% 5 7,102,000 6,246,000 5,880,000 4,716,000 9,838,000 33,782,000 5.59% 6,836,000 4.91% S 4,767,000 4.62% s 5,924,000 3.71% 4.979,000 7.74% s 7.140,000 26.57% $ 29,646,000 5.28% 3.68% 4.57% 3.84% 5.51% 22.89% S 18,972.000 s 22,935,000 S S 11,699,000 S 8,144,000 S 3,282,000 S65,032,000 Balance Sheet Current Assets Cash and Equivalents Short-Term Investments Net Receivables Inventories Other Current Assets Total Current Assets Long-Term Investments Property, Plant, and Equipment Goodwill Intangible Assets Accumulated Amortization Other Assets Deferred Long-Term Assets Total Assets 13.44% S 13,732,000 16.24% S 24,644,000 8.28% S 10,734,000 5.77% S 8,053,000 2.32% S 3,047.000 46.05% S60,210,000 10.29% S 14,523,000 18.47% $ 18,566,000 8.05% $ 10,985.000 6.04% 5 8,184.000 2.28% $ 3,486,000 45.13% $ 55,744.000 11.14% 14.24% 8.43% 6.28% 2.67% 42.76% $ S $ $ 19,893,000 44,699,000 24,187.000 16.52% 5 37.12% 20.09% 5 19,385,000 44,350,000 24,527,000 15.25% $ 24.859,000 34.88% $ 44.622,000 19.29% $ 25.010,000 19.20% 34.46% 19.31% S S 15,912,000 S 22,805,000 S 26,876,000 11.27% S 15,905,000 16.15% S 21,629.000 19.03% S 25,764,000 11.92% $ 16,126.000 16.21% $ 21,832.000 19.31% $ 27,222.000 12.37% 16.75% 20.88% $ 5,133.000 4.26% $ 5,092,000 4.01% $ 5.358,000 4.14% S 4,435.000 S 6,148,000 S 141,208,000 3.14% S 4,413,000 4.35% S 5,490,000 100.00% S 133,411,000 3.31% $ 3,232.000 4.12% $ 6,202.000 100.00% $ 130,358,000 2.48% 4.76% 100.00% $ 120,406.000 100.00% $ 127,136,000 100,00% $ 129.495,000 100.00% $ $ 16,656,000 13,554,000 S 21,603,000 S S 4,684,000 15.30% S 20,743,000 3.32% S 7,004,000 15.55% $ 21,393.000 5.25% 5 3,638,000 16.41% 2.79% $ 30,210.000 s 18,038,000 S 8.254.000 $ 8,126,000 $ 594,000 $ $ 65,222.000 13.83% $ 16,774,000 11.26% $ 11.653,000 $ 2,343,000 25.09% 5 30,770,000 14.98% 5 18,945,000 6.86% 10.325,000 6.75% 5 9,113,000 0.49% 5 642,000 54.17% $ 69,795,000 13.19% $ 16,229,000 9.17% $ 12.018,000 $ 1.84% s 1.543,000 24.20% s 29,790,000 14.90% $ 18,327,000 8.12% $ 9,149,000 7.17% $ 9,179,000 0.50% S 631,000 54.90% $ 67,076,000 $ 12.53% 9.28% 1.19% 23.00% 14.15% 7.07% 7.09% 0.49% 51.80% S S S S 26,287,000 22,442,000 19.151,000 2,910,000 18.62% S 27,747,000 15.89% S 12,857,000 13.56% S 19,095,000 2.06% S 2,562,000 20.80% $ 25,031,000 9.64% 5 15,122,000 14.31% 18,006,000 1.92% S 2,447,000 19.20% 11.60% % 13.81% 1.88% S 70,790,000 50.13% S 62,261,000 46.67% S 60,606,000 46.49% Current Liabilities Accounts Payable Short/Current Debt Other Current Liabilities Total Current Liabilities Long-Term Debt Other Liabilities Deferred Long-Term Liabilities Minority Interests Total Liabilities Stockholder's Equity Misc. Stocks Options Warrants Redeemmable Preferred Stock Preferred Stock Common Stock Retained Earnings Treasury Stock Capital Surplus Other Stockholders' Equity Total Stockholders' Equity Total Lia. & Stockholders' Equity S S 3,120,000 S 110,551,000 S (28,352,000) 2.21% S 3,120.000 78.29% $ 103,879.000 -20.08% S (22,684.000) 2.34% $ 3,120.000 77.86% $ 97,245,000 -17.00% $ (19,891,000) 2.39% 74.60% -15.26% $ 4,009,000 3.33% 4,009,000 3.15% $ 4,009,000 $ 96,124,000 79.83% $ 87.953,000 69.18% $ 84.807,000 $ (93,715,000) -77.83% $ (82,176,000) -64.64% $ (77.226,000) $ 63,641,000 52.86% $ 63,714,000 50.11% $ 63.852,000 $ (15,881,000) -13.19% $ (17,197,000) -13.53% $ (14,100,000) ( 3 ( $ $ 55,184,000 45.83% 5 57,341,000 45.10% $ 62.419,000 $ 120,406.000 100.00% 5 127,136,000 100.00% $ 129.495,000 $ % S 3.10% 65.49% -59.64% 49.31% -10.89% 48.20% 100.00% S (14,901,000) -10.55% S (13,165,000) -9.87% $ (10.722.000) S 70,418,000 49.87% S 71,150,000 53.33% $ 69,752.000 S 141,208,000 100.00% S 133,411,000 100.00% $ 130,358.000 % -8.23% 53.51% 100.00% Solution Procter & Gamble 2016 Johnson & Johnson 2016 2017 2015 2017 2015 Net Profit Margin Inventory Turnover Current Ratio Return on Assets Return on Equity Debt to Equity Earnings Per Share Points 0 1 1 1 1 1 1 Requirements 1. Start Excel - completed. 2. In cell D74, by using cell references, calculate the net profit margin percentage for Procter & Gamble in year 2017. Use the relevant cells from the Given Data section. 3. In cell D75, by using cell references, calculate the inventory tumover for Procter & Gamble in year 2017. Use the relevant cells from the Given Data section. 4. In cell D76, by using cell references, calculate the current ratio for Procter & Gamble in year 2017. Use the relevant cells from the Given Data section. 5. In cell D77, by using cell references, calculate the retum on assets percentage for Procter & Gamble in year 2017. Use the relevant cells from the Given Data section. 6. In cell D78, by using cell references, calculate the retum on equity percentage for Procter & Gamble in year 2017. Use the relevant cells from the Given Data section. 7. In cell D79, by using cell references, calculate the debt to equity ratio for Procter & Gamble in year 2017. Use the relevant cells from the Given Data section. In cell ranges F74:F79, H74:F79, K74:K79, M74:M79, 074:079, by using cell references, calculate the gross margin, inventory tumover, current ratio, retum on assets, retum on equity, and debt to equity ratios for 8. Procter & Gamble in year 2016 and 2015, and for Johnson & Johnson in the three years. Copy the contents from cells D74:D79 and paste the contents to cell ranges F74:F79, H74:H79, K74:K79, M74:M79, and 074:079. 9. In cell D80, by using cell references, calculate the earnings per share for Procter & Gamble in year 2017. Use the relevant cells from the Given Data section. 10. In cells F80 and H80, by using absolute and relative cell references, calculate the earnings per share ratios for Procter & Gamble in years 2016 and 2015, respectively. Use the relevant cells from the Given Data section. Copy the content from cell D80 and paste it to cells F80 and H80. 11. In cell K80, by using cell references, calculate the earnings per share for Johnson & Johnson in year 2017. Use the relevant cells from the Given Data section. 12. In cells M80 and 080, by using absolute and relative cell references, calculate the earnings per share ratios for Johnson & Johnson in years 2016 and 2015, respectively. Use the relevant cells from the Given Data section. Copy the content from cell K80 and paste it to cells M80 and 080. 13. Save the workbook. Close the workbook and then exit Excel. Submit the workbook as directed. 1 1 1 1 1 0
Step by Step Solution
There are 3 Steps involved in it

Get step-by-step solutions from verified subject matter experts