

Question: Please include the graph as well! 3. Costs In 1997, Fuller and coworkers45 at Texas A&M Uni- versity estimated the operating costs of cotton gin
Please include the graph as well!
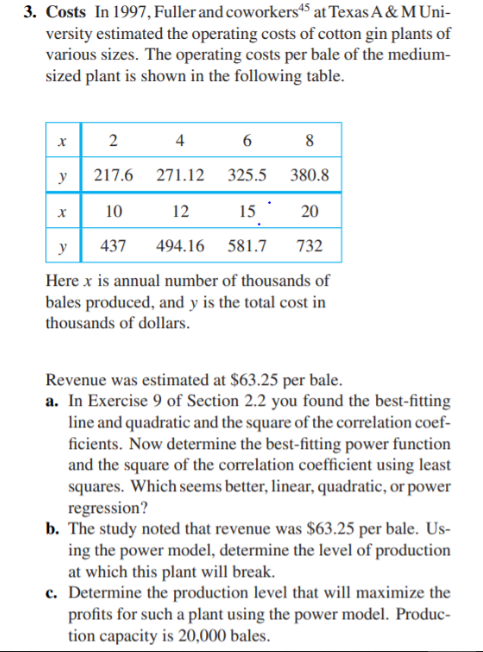
3. Costs In 1997, Fuller and coworkers45 at Texas A&M Uni- versity estimated the operating costs of cotton gin plants of various sizes. The operating costs per bale of the medium- sized plant is shown in the following table. x 2 4 6 8 217.6 271.12 325.5 380.8 10 12 15 20 437 494.16 581.7 732 Here x is annual number of thousands of bales produced, and y is the total cost in thousands of dollars. Revenue was estimated at $63.25 per bale. a. In Exercise 9 of Section 2.2 you found the best-fitting line and quadratic and the square of the correlation coef- ficients. Now determine the best-fitting power function and the square of the correlation coefficient using least squares. Which seems better, linear, quadratic, or power regression? b. The study noted that revenue was $63.25 per bale. Us- ing the power model, determine the level of production at which this plant will break. c. Determine the production level that will maximize the profits for such a plant using the power model. Produc- tion capacity is 20,000 bales
Step by Step Solution
There are 3 Steps involved in it

Get step-by-step solutions from verified subject matter experts