

Question: PLEASE INCLUDED EXPLAIN FOR CALCULATION. THANK YOU SO MUCH. Using the attached financial statements, calculate the following statements for both the Bro Co Shoes and
PLEASE INCLUDED EXPLAIN FOR CALCULATION. THANK YOU SO MUCH.
- Using the attached financial statements, calculate the following statements for both the Bro Co Shoes and the I-Ran Shoe Company.
| Ratios | Formulas | Bro. Co. | I-Ran |
| Earnings per share (EPS) |
|
|
|
| Current Ratio |
|
|
|
| Net Profit Margin |
|
|
|
| Return on Assets (ROA) |
|
|
|
| Return on Equity (ROE) |
|
|
|
| Interest Coverage Ratio |
|
|
|
| Debt-to Asset Ratio |
|
|
|
- Use the results of your ratio analysis to identify similarities and differences in the profitability and risk profiles of each of the two firms.
- How would these findings be incorporated into a strategic analysis of these firms?
- Based on your calculations, what are your recommendations for each company? Which would you invest in? Why?
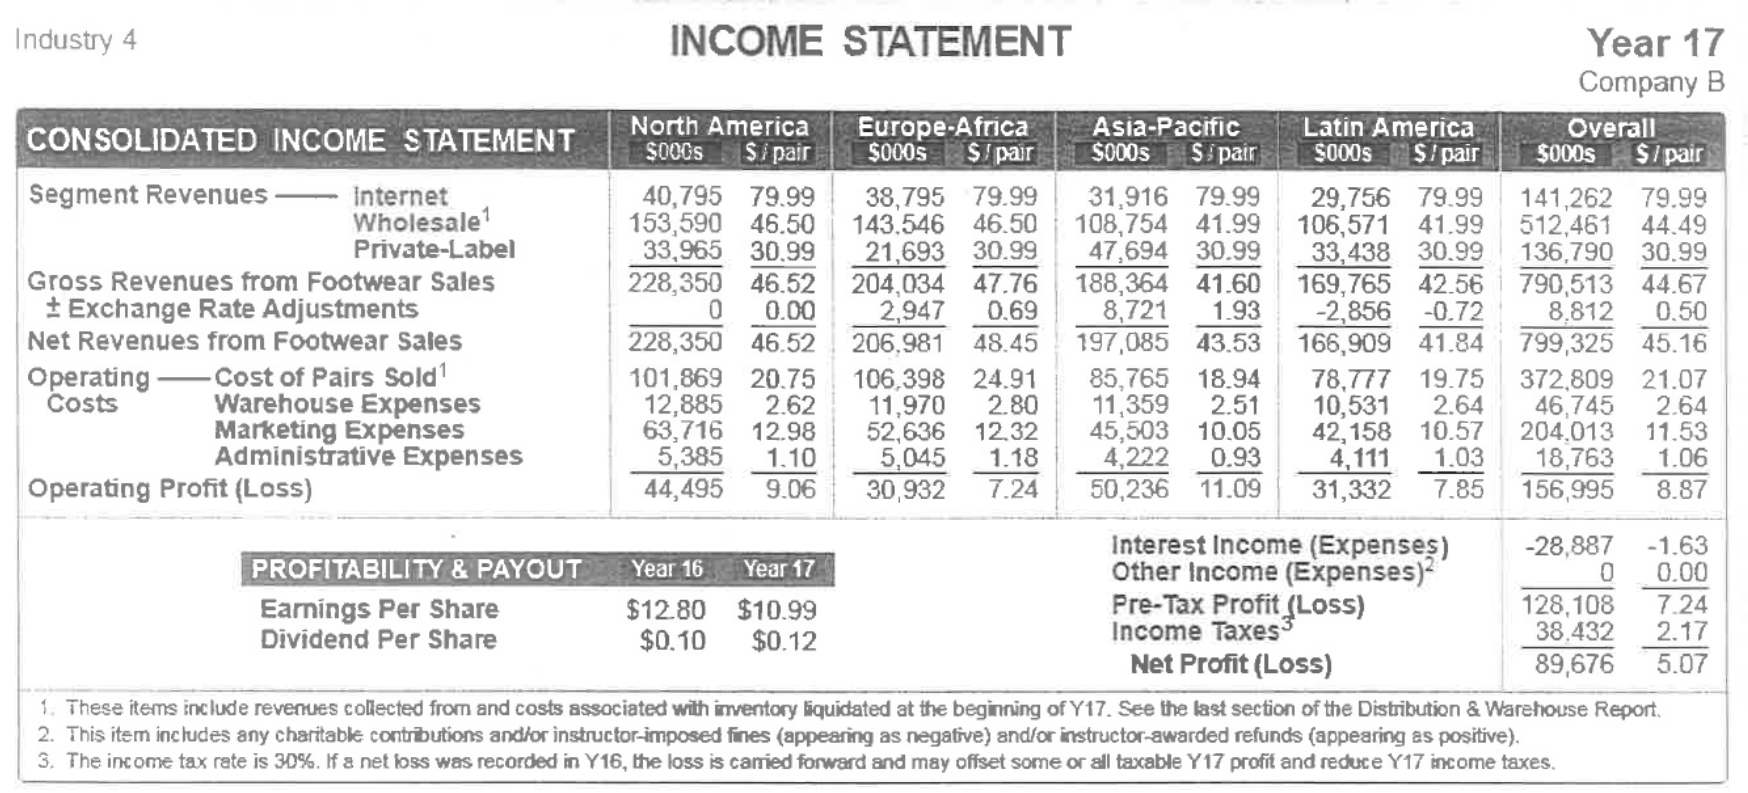
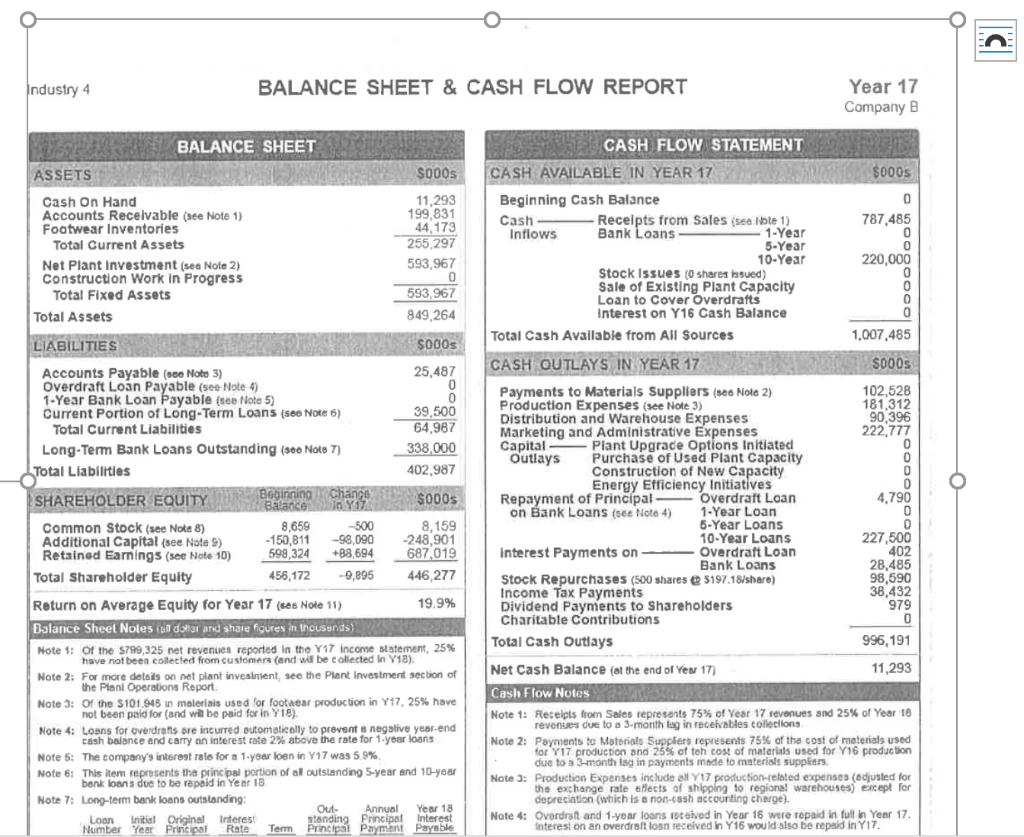
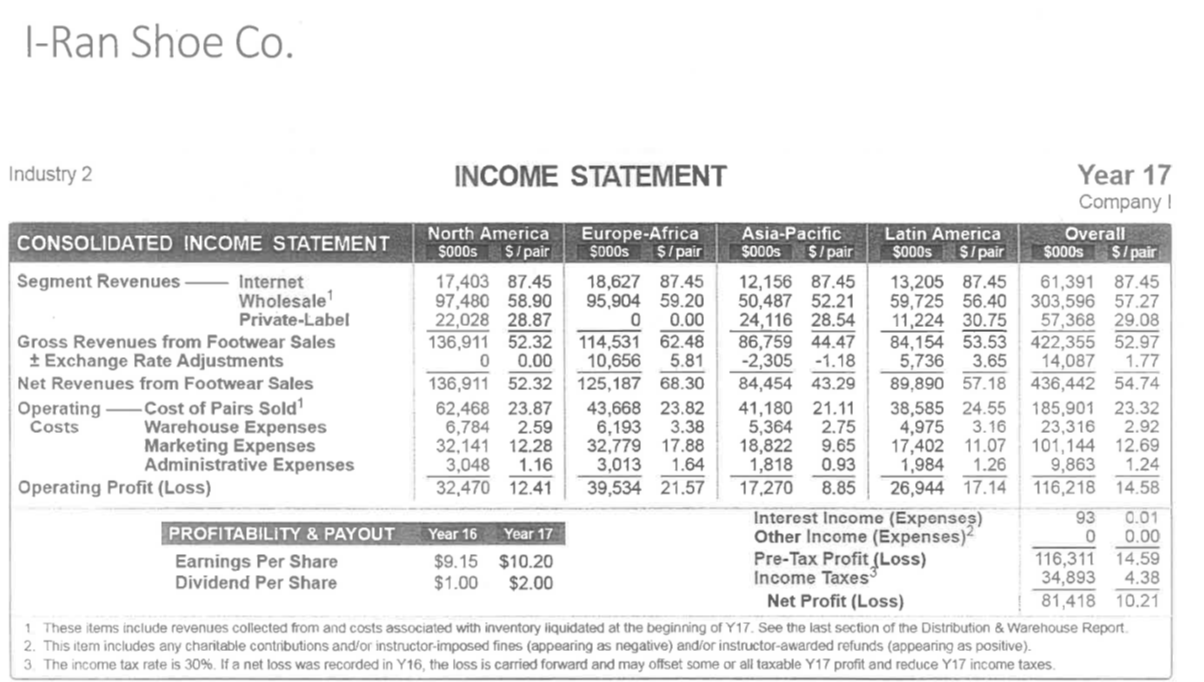
Industry 4 INCOME STATEMENT Year 17 Company B CONSOLIDATED INCOME STATEMENT North America Europe-Africa Asia-Pacific Latin America Overall SOOCS Si pair $0005 $ pair $000S Spain $000s $/ pair $000s $/pair Segment Revenues Internet 40,795 79.99 38,795 79.99 31,916 79.99 29,756 79.99 141,262 79.99 Wholesale 153,590 46.50 143,546 46.50 108,754 41.99 106,571 41.99 512,461 44.49 Private-Label 33,965 30.99 21,693 30.99 47,694 30.99 33,438 30.99 136,790 30.99 Gross Revenues from Footwear Sales 228,350 46.52 204,034 47.76 188,364 41.60 169,765 42.56 790,513 44.67 * Exchange Rate Adjustments 0 0.00 2,947 0.69 8,721 1.93 -2,856 -0.72 8.812 0.50 Net Revenues from Footwear Sales 228,350 46.52 206.981 48.45 197,085 43.53 166,909 41.84 799,325 45.16 Operating -Cost of Pairs Sold! 101,869 20.75 106,398 24.91 85,765 18.94 78,777 19.75 372,809 21.07 Costs Warehouse Expenses 12,885 2.62 11,970 2.80 11,359 2.51 10,531 2.64 46,745 2.64 Marketing Expenses 63,716 12.98 52,636 12.32 45,503 10.05 42, 158 10.57 204.013 11.53 Administrative Expenses 5,385 1.10 5,045 1.18 4,222 0.93 4,111 1.03 18,763 1.06 Operating Profit (Loss) 44,495 9.06 30,932 7.24 50,236 11.09 31,332 7.85 156,995 8.87 Interest Income (Expenses) -28,887 -1.63 PROFITABILITY & PAYOUT Year 16 Year 17 Other Income (Expenses)? 0.00 Earnings Per Share $12.80 $10.99 Pre-Tax Profit (Loss) 128,108 7.24 Dividend Per Share $0.10 $0.12 Income Taxes 38.432 2.17 Net Profit (Loss) 89,676 5.07 1. These items include revenues collected from and costs associated with mentory liquidated at the beginning of Y17. See the last section of the Distribution & Warehouse Report, 2. This item includes any charitable contributions and/or instructor-imposed fines (appearing as negative) and/or instructor-awarded refunds (appearing as positive). 3. The income tax rate is 30%. If a net loss was recorded in Y16, the loss is carried forward and may offset some or all taxable Y 17 profit and reduce Y17 income taxes. > Industry 4 BALANCE SHEET & CASH FLOW REPORT Year 17 Company B BALANCE SHEET ASSETS S000s Cash On Hand Accounts Receivable (see Note 1) Footwear Inventories Total Current Assets Net Plant Investment (sea Note 2) Construction Work in Progress Total Fixed Assets Total Assets 11,293 199 831 44,173 255,297 593,967 0 593,967 849,264 CASH FLOW STATEMENT CASH AVAILABLE IN YEAR 17 $000s Beginning Cash Balance 0 Cash -Receipts from Sales (see Note 1) 787,485 Inflows Bank Loans 1-Year 0 5-Year 0 10-Year 220,000 Stock Issues (Oshares issued) 0 Sale of Existing Plant Capacity 0 Loan to Cover Overdrafts 0 Interest on Y16 Cash Balance 0 Total Cash Available from All Sources 1,007,485 CASH OUTLAYS IN YEAR 17 SOODS Payments to Materials Suppliers (see Note 2) 102,528 Production Expenses (see Note 3) 181,312 Distribution and Warehouse Expenses 90,396 Marketing and Administrative Expenses 222,777 Capital Plant Upgrade Options Initiated 0 Outlays Purchase of Used Plant Capacity 0 Construction of New Capacity D Energy Efficiency Initiatives D Repayment of Principal Overdraft Loan 4,790 on Bank Loans (oce Note 4) 1-Year Loan 0 5-Year Loans 0 10-Year Loans 227,500 Interest Payments on Overdraft Loan 402 Bank Loans 28,485 Stock Repurchases (500 shares @ 5197.18/share) 98,590 Income Tax Payments 38,432 Dividend Payments to Shareholders Charitable Contributions 0 Total Cash Outlays 996, 191 Net Cash Balance at the end of Yen 17) 11,293 Cash Flow Notes Note 1: Receipts from Sales represents 75% of Year 17 revenues and 25% of Year 16 revonues due to a 3-month tag in receivables colleclions Note 2: Payments to Materials Suppliers represents 75% of the cost of materials used for Y17 production and 25% of teh cost of materials used for Y16 production due to a 3-month lsg in payments made to materials suppliers. Note 3: Production Expenses include all 17 production-related expenses (adjusted for the exchange rate affects of shipping to regional warehouses) except for depreciation (which is a non-cash accounting charge). Note 4: Overdraft and 1-year loans isceived in Year 16 were repaid in full in Year 17 Interest on an overdraft loan received in Y16 would also be repaid in Y17 LIABILITIES "S000s Accounts Payable (se Note 3) 25,487 Overdraft Loan Payable (see Note 4) 0 1-Year Bank Loan Payable (see Note 5) 0 Current Portion of Long-Term Loans (see Note 6) 39,500 Total Current Liabilities 64,987 Long-Term Bank Loans Outstanding (se Noto 7) 338,000 Total Liabilities 402,987 SHAREHOLDER EQUITY Beginning Change S000s Balance 10 Y17 Common Stock (see Note 8) 8,659 -500 8,159 Additional Capital (see Nota 9) -98,090 -248,901 Retained Earnings (see Note 10) 598,324 +88,694 687,019 Total Shareholder Equity 456,172 9,895 446,277 Return on Average Equity for Year 17 (see Nole 11) 19.9% Balance Sheet Noles (all dollar ard share figures in thousands) Note 1: or the $799,325 net revenues reported in the Y17 Income statement, 25% have not been collected from customers and will be collected in V18) Note 2: For more details on net plant investnient, see the Plant Investment section of the Plani Operations Report Note 3: Of the S101.948 in maleriais used for footwear production in Y17, 25% have not been paid for (and will be paid for in Y18) Note 4: Loons for overdrafts are incurred automatically to provent a negative year-end cash balance and carry an interest rate 2% above the rate for 1-year loans Note 5: The company's interest ralo for a 1-year loen in Y17 was 5.9% Note 6: This item represents the principal portion of al outstanding 5-year and 10-year bank loans due to be repaid in Year 18 Note 7: Long-term bank loans outstanding Out Annual Year 18 Loon Number Year Principal Rate Interest Initial Original Term Pranding Payment Payable -150,811 979 T-Ran Shoe Co. INCOME STATEMENT Industry 2 Year 17 Company 1 CONSOLIDATED INCOME STATEMENT North America Europe-Africa Asia-Pacific Latin America Overall $000s $/pair $000s $/pair $000s $/pair $000s $/pair $000s $/ pair Segment Revenues Internet 17,403 87.45 18,627 87.45 12,156 87.45 13,205 87.45 61,391 87.45 Wholesale 97,480 58.90 95,904 59.20 50,487 52.21 59,725 56.40 303,596 57.27 Private Label 22,028 28.87 0 0.00 24,116 28.54 11,224 30.75 57,368 29.08 Gross Revenues from Footwear Sales 136,911 52.32 114,531 62.48 86,759 44.47 84,154 53.53 422,355 52.97 + Exchange Rate Adjustments 0 0.00 10,656 5.81 -2,305 -1.18 5,736 3.65 14,087 1.77 Net Revenues from Footwear Sales 136,911 52.32 125,187 68.30 84,454 43.29 89,890 57.18 436,442 54.74 Operating -Cost of Pairs Sold! 62,468 23.87 43,668 23.82 41,180 21.11 38,585 24.55 185,901 23.32 Costs Warehouse Expenses 6,784 2.59 6,193 3.38 5,364 2.75 4,975 3.16 23,316 2.92 Marketing Expenses 32,141 12.28 32,779 17.88 18,822 9.65 17,402 11.07 101,144 12.69 Administrative Expenses 3,048 1.16 3,013 1.64 1,818 0.93 1,984 1.26 9,863 1.24 Operating Profit (Loss) 32,470 12.41 39,534 21.57 17,270 8.85 26,944 17.14 116,218 14.58 Interest Income (Expenses) 93 0.01 PROFITABILITY & PAYOUT Year 16 Year 17 Other Income (Expenses)? 0 0.00 Earnings Per Share $9.15 $10.20 Pre-Tax Profit (Loss) 116,311 14.59 Dividend Per Share $1.00 $2.00 Income Taxes 34,893 4.38 Net Profit (Loss) 81,418 10.21 1 These items include revenues collected from and costs associated with inventory liquidated at the beginning of Y17. See the last section of the Distribution & Warehouse Report 2. This item includes any charitable contributions and/or instructor-imposed fines (appearing as negative) and/or instructor-awarded refunds (appearing as positive). 3. The income tax rate is 30%. Ifa net loss was recorded in Y16, the loss is carried forward and may offset some or all taxable Y17 profit and reduce Y17 income taxes
Step by Step Solution
There are 3 Steps involved in it

Get step-by-step solutions from verified subject matter experts