

Question: Please interpret the graph above, bearing in mind that it is the result of a Dea Window analysis for 5 countries in Rstudio for years
Please interpret the graph above, bearing in mind that it is the result of a Dea Window analysis for 5 countries in Rstudio for years 2015-2019 and these variables were taken: gross national income, GDP per capita, income from exports and imports, health and education expenses, the level of inflation and investments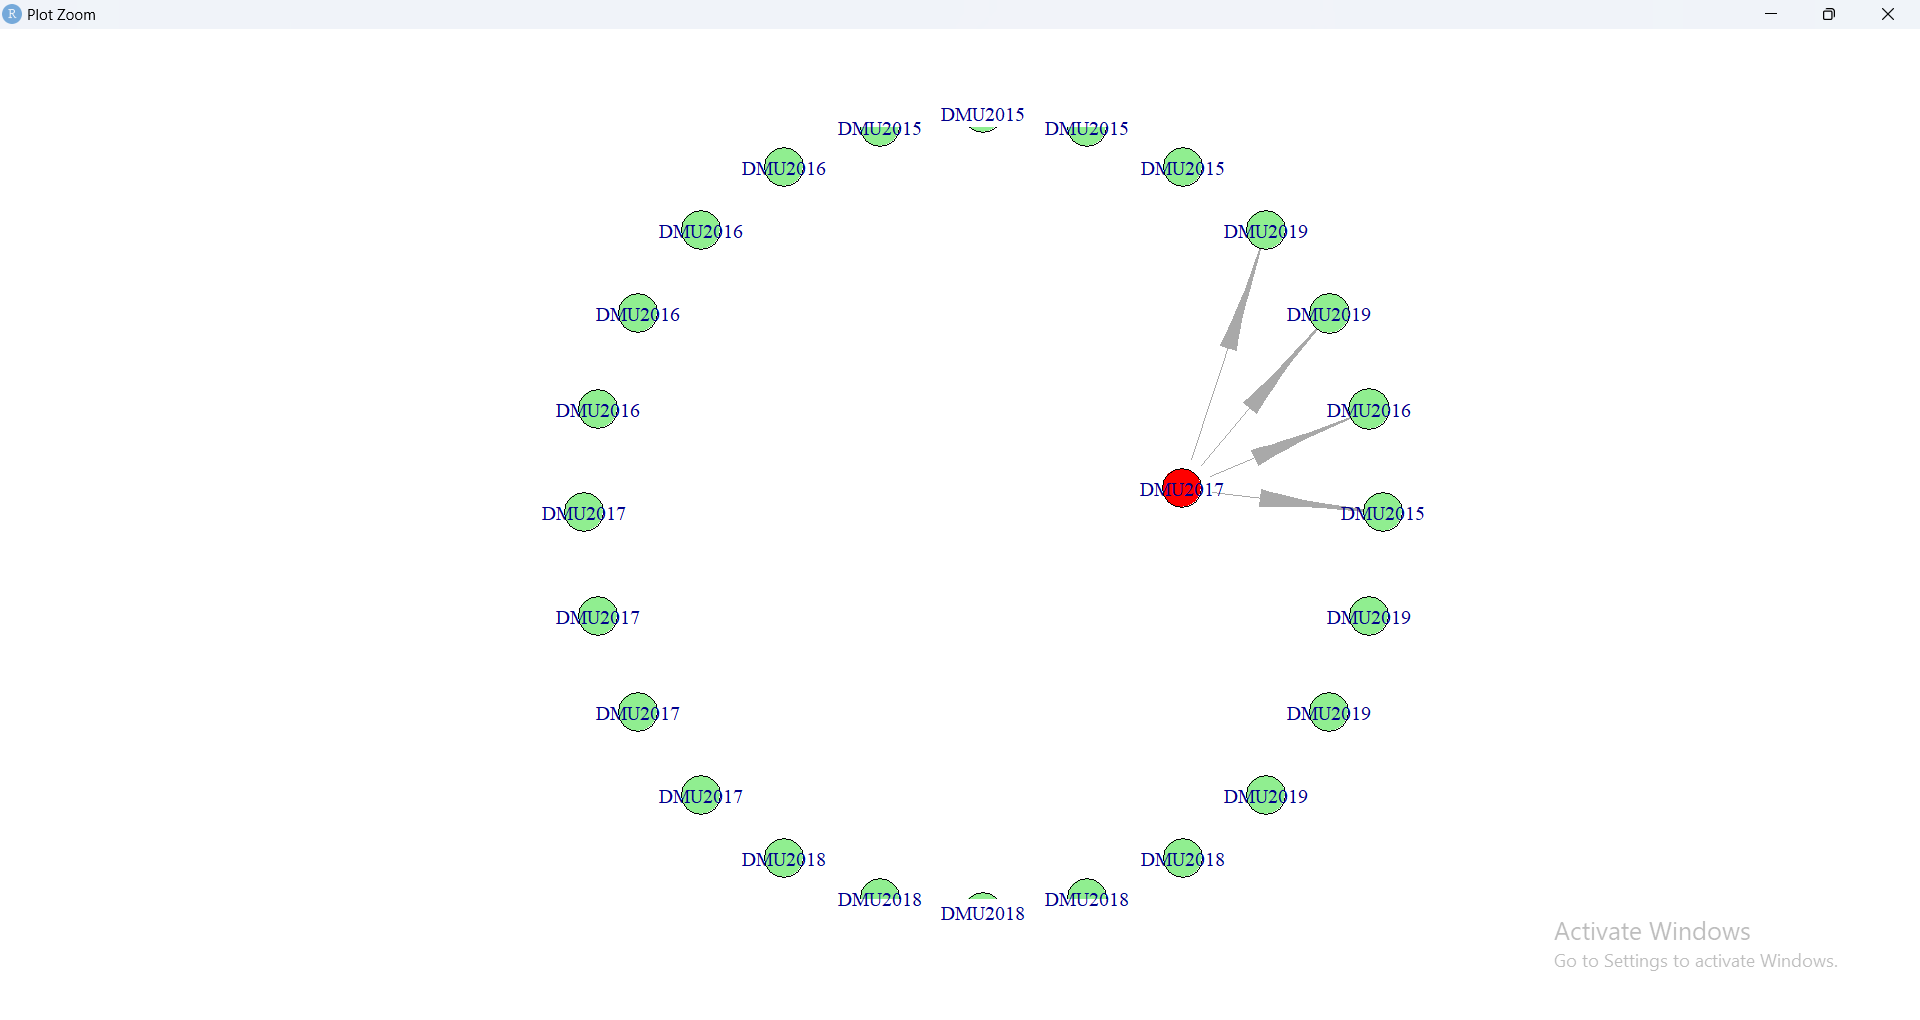
Step by Step Solution
There are 3 Steps involved in it
1 Expert Approved Answer
Step: 1 Unlock

Question Has Been Solved by an Expert!
Get step-by-step solutions from verified subject matter experts
Step: 2 Unlock
Step: 3 Unlock