

Question: Please interpret three of the five variables in the model (Post, Vent, CharlsScore, Female, or DisNSG) in a natural language sentence. (6 points) *Refer to
Please interpret three of the five variables in the model (Post, Vent, CharlsScore, Female, or DisNSG) in a natural language sentence. (6 points)
*Refer to tables
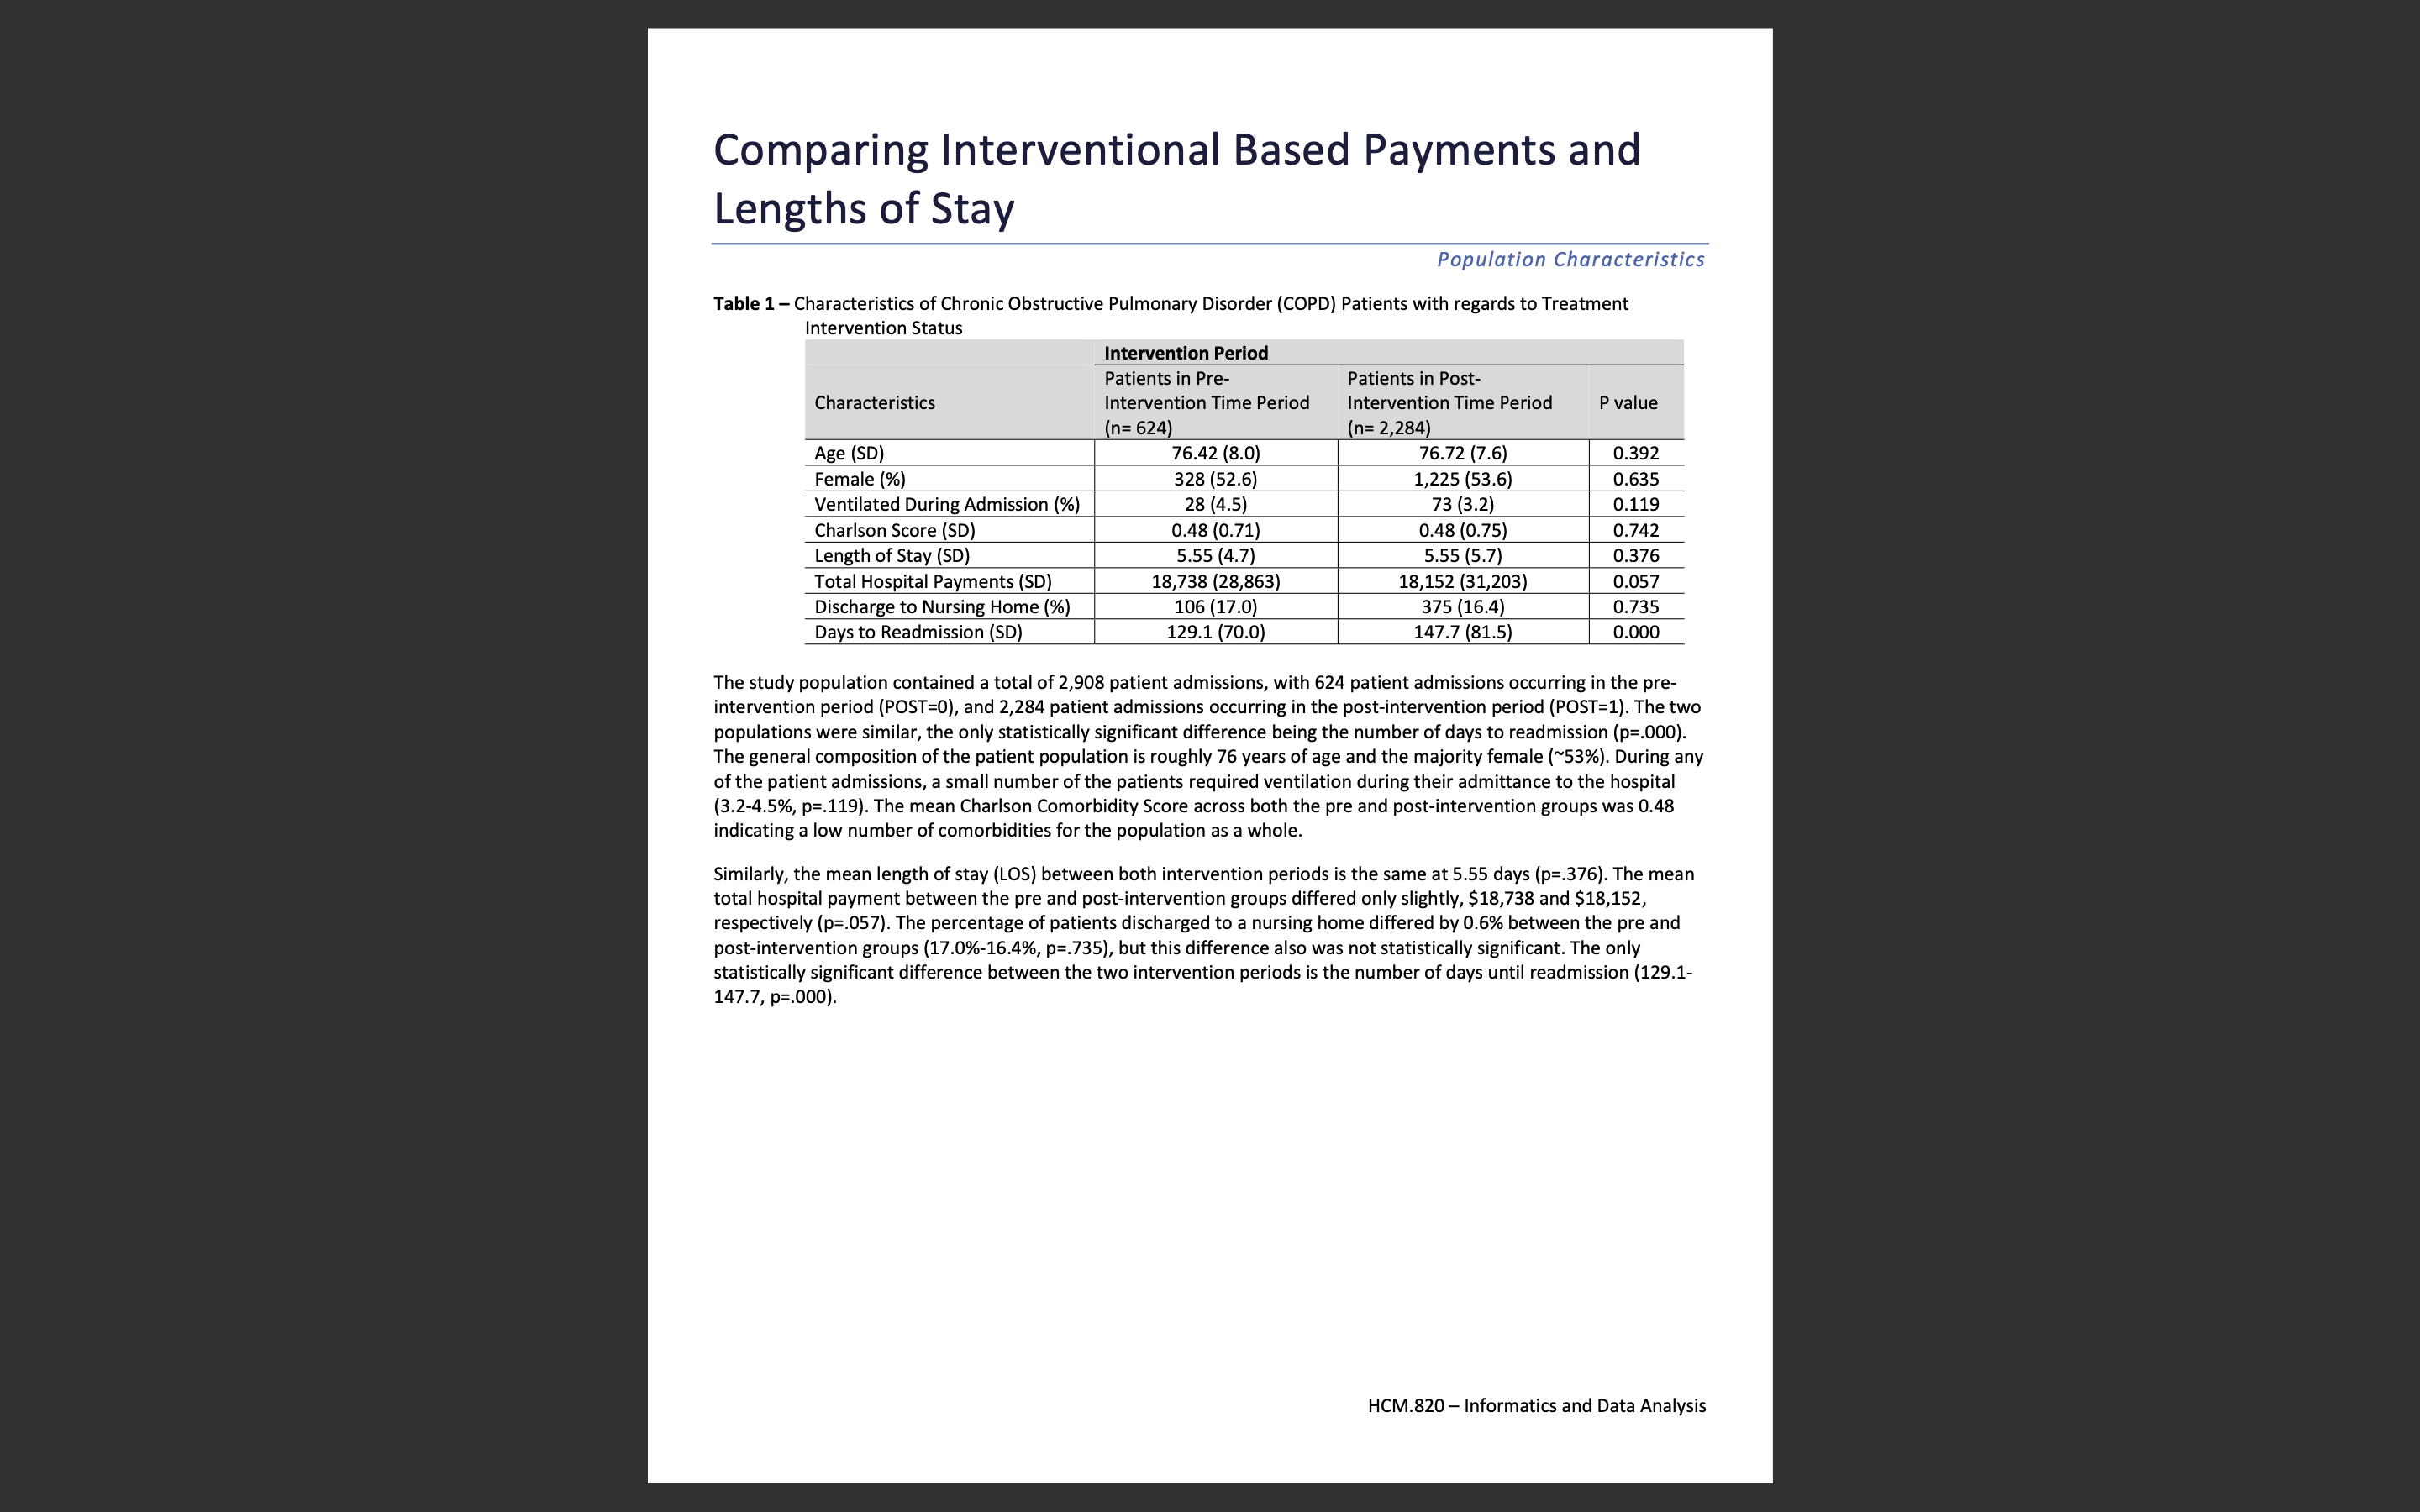

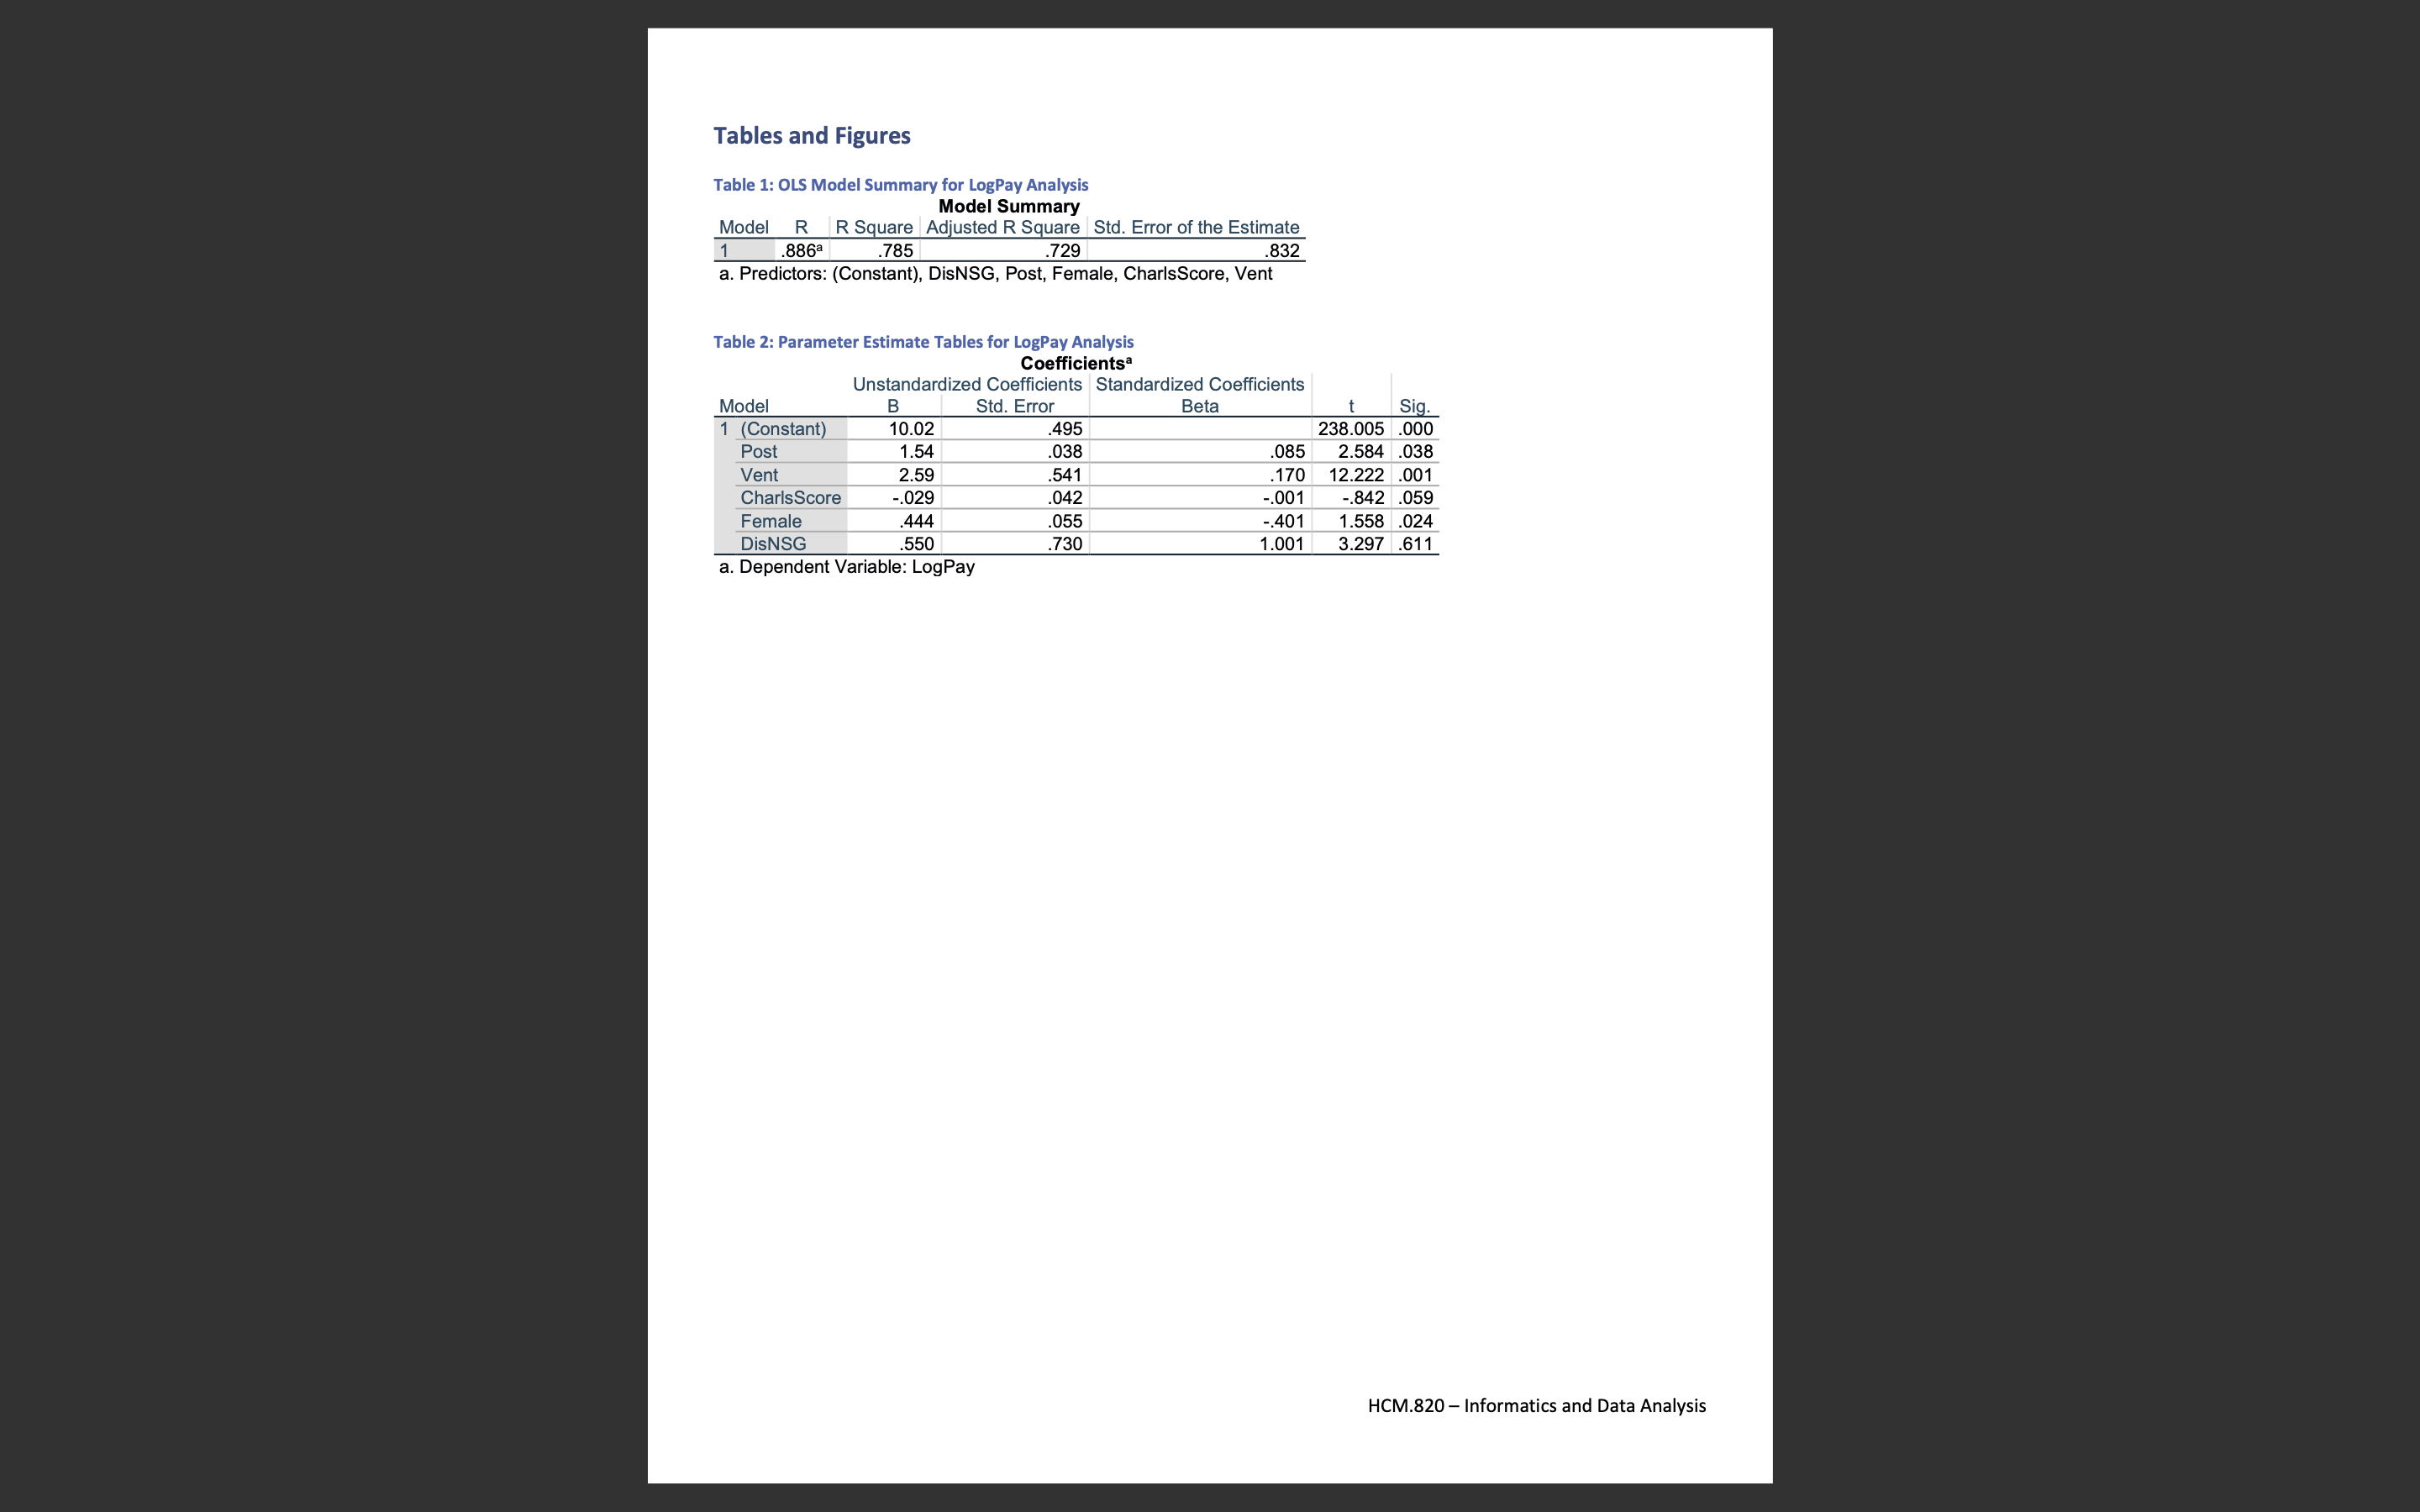
Comparing Interventional Based Payments and Lengths of Stay Population Characteristics Table 1 Characteristics of Chronic Obstructive Pulmonary Disorder (COPD) Patients with regards to Treatment Intervention Status Intervention Period Characteristics Patients In Pre- Intervention Time Period (n= 624) Patiens In Post- Intervention Time Period in: 2,284) P value Age 159) 76.42 (8.0) 75.72 (7.5) 0.392 Female [56) 328 (52.5) 1,225 (53.5) 0.635 Ventilated During Admission ($6) 28 (4.5) 73 (3.2) 0.119 Charlson Score (SD) 0.43 (0.71) 0.43 (0.75) 0.742 Length of Stay (SD) 5.55 (4.7) 5.55 (5.7) 0.376 Total Hospital Payments (SD) 18,738 (23,353) 13,152 (31,203) 0057 Discharge to Nursing Home (96) 105 (17.0) 375 (15.4) 0.735 Days to Readmission (SD) 129.1 (70.0) 147.7 (81.5) 0.000 The study population contained a total of 2,903 patient admissions, with 624 patient admissions occurring in the pre- intervention period (POST=0), and 2,284 patient admissions occurring in the post-intervention period (POST ), The two populations were similar, the only statistically significant difference being the number of days to readmission (p=.000). The general composition ofthe patient population Is roughly 76 years of age and the majority female ("53%). During any of the patient admissions, a small number of the patients required ventilation during their admittance to the hospital (SJ4.5%, p=.119). The mean Charlson Comorhidity Score across both the pre and postintervention groups was 0.48 indicating a low number of comorbidities for the population as a whole. Similarly, the mean length of stay (L05) between both intervention periods is the same at 5.55 days (p=.376). The mean total hospital payment between the pre and post-intervention groups differed only slightly, $18,738 and $18,152. respectively (p=.057). The percentage of patients discharged to a nursing home differed by 0.6% between the pre and post-intenlen on groups (limit-16.4%, p=.735), but this difference also was not statistically signicant. The only statistically signicant difference between the two intervention periods is the number of days until readmission (129.1- 147.7. p=.ooo). HCM.820 Informatics and Data Analysis Tables and Figures Table 1: OLS Model Summary for LogPay Analysis Model Summary Model R R Square Adjusted R Square Std. Error of the Estimate 1 .886a .785 .729 .832 a. Predictors: (Constant), DisNSG, Post, Female, CharlsScore, Vent Table 2: Parameter Estimate Tables for LogPay Analysis Coefficients Unstandardized Coefficients Standardized Coefficients Model B Std. Error Beta Sig. 1 (Constant) 10.02 .495 238.005 .000 Post 1.54 .038 .085 2.584 .038 Vent 2.59 541 .170 12.222 .001 CharlsScore 029 .042 -.001 -.842 .059 Female 444 055 -.401 1.558 .024 DisNSG 550 .730 1.001 3.297 .611 a. Dependent Variable: LogPay HCM.820 - Informatics and Data Analysis
Step by Step Solution
There are 3 Steps involved in it

Get step-by-step solutions from verified subject matter experts