

Question: please just do question two. thank you! Question 1 (20 points) Table 27-6 Potential Real Price Year GDP Real GDP Level 2019 $11.0 trillion $11.0
please just do question two. thank you!
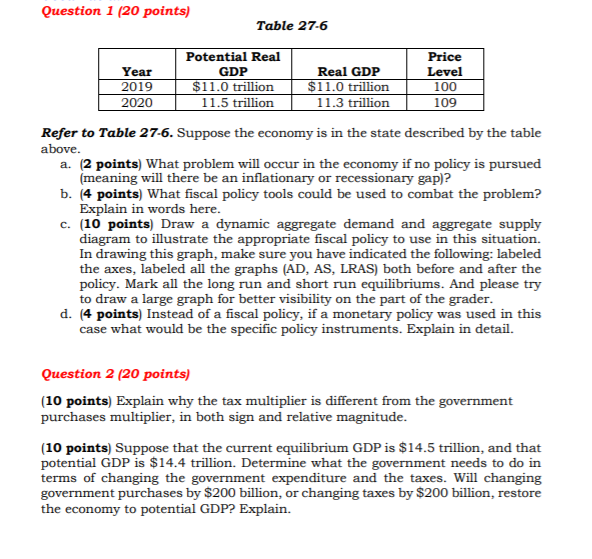
Question 1 (20 points) Table 27-6 Potential Real Price Year GDP Real GDP Level 2019 $11.0 trillion $11.0 trillion 100 2020 11.5 trillion 11.3 trillion 109 Refer to Table 27-6. Suppose the economy is in the state described by the table above. a. (2 points) What problem will occur in the economy if no policy is pursued (meaning will there be an inflationary or recessionary gap)? b. (4 points) What fiscal policy tools could be used to combat the problem? Explain in words here. c. (10 points) Draw a dynamic aggregate demand and aggregate supply diagram to illustrate the appropriate fiscal policy to use in this situation. In drawing this graph, make sure you have indicated the following: labeled the axes, labeled all the graphs (AD, AS, LRAS) both before and after the policy. Mark all the long run and short run equilibriums. And please try to draw a large graph for better visibility on the part of the grader. d. (4 points) Instead of a fiscal policy, if a monetary policy was used in this case what would be the specific policy instruments. Explain in detail. Question 2 (20 points) (10 points) Explain why the tax multiplier is different from the government purchases multiplier, in both sign and relative magnitude. (10 points) Suppose that the current equilibrium GDP is $14.5 trillion, and that potential GDP is $14.4 trillion. Determine what the government needs to do in terms of changing the government expenditure and the taxes. Will changing government purchases by $200 billion, or changing taxes by $200 billion, restore the economy to potential GDP? Explain
Step by Step Solution
There are 3 Steps involved in it

Get step-by-step solutions from verified subject matter experts