

Question: Please keep a simple answer, thanks in advance. 2. Study the following chart and answer the questions below. U.S. Debt as a % of GDP
Please keep a simple answer, thanks in advance.
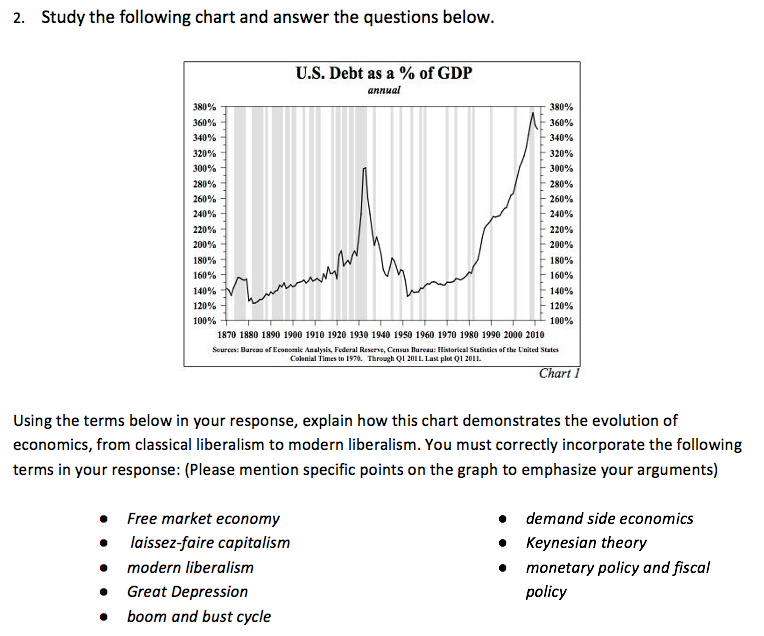
2. Study the following chart and answer the questions below. U.S. Debt as a % of GDP annual 380% 380% 360% 360% 340% 340% 320% 320% 300% 300% 280% 280% 260% 260% 240% 240% 220% 220% 200% 200% 180% 180% 160% - 160% 140% 120% - 120% 100% 100% 1870 1880 1890 1900 1910 1920 1930 1940 1950 1960 1970 1980 1990 2000 2010 Sources: Bureau of Economic Analysis, Federal Reserve, Census Bureau: Historical Statistics of the United States Colonial Times to 1970. Through Q1 201 1. Last plot Q1 2011. Chart 1 Using the terms below in your response, explain how this chart demonstrates the evolution of economics, from classical liberalism to modern liberalism. You must correctly incorporate the following terms in your response: (Please mention specific points on the graph to emphasize your arguments) Free market economy demand side economics laissez-faire capitalism . Keynesian theory modern liberalism . monetary policy and fiscal Great Depression policy . boom and bust cycle
Step by Step Solution
There are 3 Steps involved in it

Get step-by-step solutions from verified subject matter experts