

Question: Please kindly give MATLAB code for the following 13. Create the histograms for the genuine and imposter scores: histogramGenuine histc(genuineScores, xRange); histogramlmposter- histc(imposterScores, xRange): 14.
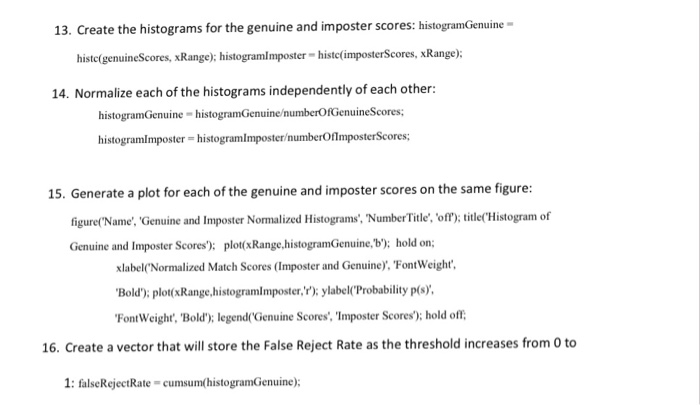
13. Create the histograms for the genuine and imposter scores: histogramGenuine histc(genuineScores, xRange); histogramlmposter- histc(imposterScores, xRange): 14. Normalize each of the histograms independently of each other: histogramGenuine histogramGenuineumberOfGenuineScores; histogramlmposter- histogramimposterumberOflmposterScores; 15. Generate a plot for each of the genuine and imposter scores on the same figure: figure(Name', 'Genuine and Imposter Normalized Histograms, NumberTitle', 'off); itleHistogram of Genuine and Imposter Scores): plot(xRange.histogramGenuine,b'): hold on xlabel Normalized Match Scores (Imposter and Genuine), FontWeight Bold'); plot(xRange.histogramlmposter,'): ylabel(Probability p(s) FontWeight, Bold')y legendr'Genuine Scores, Imposter Scores); hold off 16. Create a vector that will store the False Reject Rate as the threshold increases from 0 to 1: falseRejectRate-cumsum(histogramGenuine)
Step by Step Solution
There are 3 Steps involved in it

Get step-by-step solutions from verified subject matter experts