

Question: please kindly only answer e,f,g,h. thank you so much. here is more info. the question had 8 part the answer for first 4 part is
 please kindly only answer e,f,g,h.
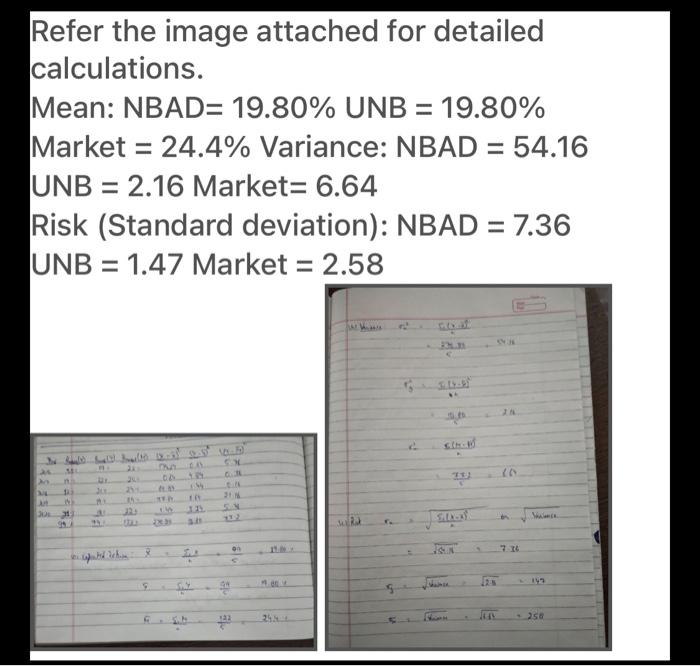 here is more info. the question had 8 part the answer for first 4 part is here and i need for the other 4 parts. thank you
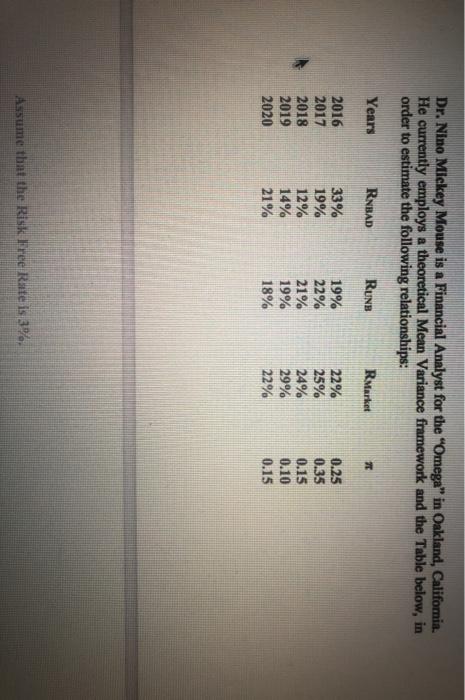
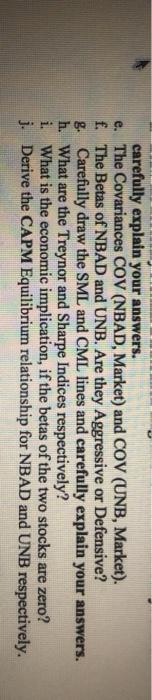
Dr. Nino Mickey Mouse is a Financial Analyst for the "Omega" in Oakland, California. He currently employs a theoretical Mean Variance framework and the Table below, in order to estimate the following relationships: Years RABAD RUNB RMarket 7 2016 2017 2018 2019 2020 33% 19% 12% 14% 21% 19% 22% 21% 19% 18% 22% 25% 24% 29% 22% 0.25 0.35 0.15 0.10 0.15 Assume that the Risk Free Rate is 3% carefully explain your answers. e. The Covariances COV (NBAD, Market) and COV (UNB, Market). f. The Betas of NBAD and UNB. Are they Aggressive or Defensive? g. Carefully draw the SML and CML lines and carefully explain your answers. h. What are the Treynor and Sharpe Indices respectively? i. What is the economic implication, if the betas of the two stocks are zero? j. Derive the CAPM Equilibrium relationship for NBAD and UNB respectively. Refer the image attached for detailed calculations. Mean: NBAD= 19.80% UNB = 19.80% Market = 24.4% Variance: NBAD = 54.16 UNB = 2.16 Market= 6.64 Risk (Standard deviation): NBAD = 7.36 UNB = 1.47 Market = 2.58 S 30 31 11 00 5 NE 25 . 250 Dr. Nino Mickey Mouse is a Financial Analyst for the "Omega" in Oakland, California. He currently employs a theoretical Mean Variance framework and the Table below, in order to estimate the following relationships: Years RABAD RUNB RMarket 7 2016 2017 2018 2019 2020 33% 19% 12% 14% 21% 19% 22% 21% 19% 18% 22% 25% 24% 29% 22% 0.25 0.35 0.15 0.10 0.15 Assume that the Risk Free Rate is 3% carefully explain your answers. e. The Covariances COV (NBAD, Market) and COV (UNB, Market). f. The Betas of NBAD and UNB. Are they Aggressive or Defensive? g. Carefully draw the SML and CML lines and carefully explain your answers. h. What are the Treynor and Sharpe Indices respectively? i. What is the economic implication, if the betas of the two stocks are zero? j. Derive the CAPM Equilibrium relationship for NBAD and UNB respectively. Refer the image attached for detailed calculations. Mean: NBAD= 19.80% UNB = 19.80% Market = 24.4% Variance: NBAD = 54.16 UNB = 2.16 Market= 6.64 Risk (Standard deviation): NBAD = 7.36 UNB = 1.47 Market = 2.58 S 30 31 11 00 5 NE 25 . 250
Step by Step Solution
There are 3 Steps involved in it

Get step-by-step solutions from verified subject matter experts