

Question: PLEASE LABEL AS QUESTION #8 & #9 CableTech Bell Corporation (CTB) operates in the telecommunications industry. CTB has two divisions: the Phone Division and the
PLEASE LABEL AS QUESTION #8 & #9
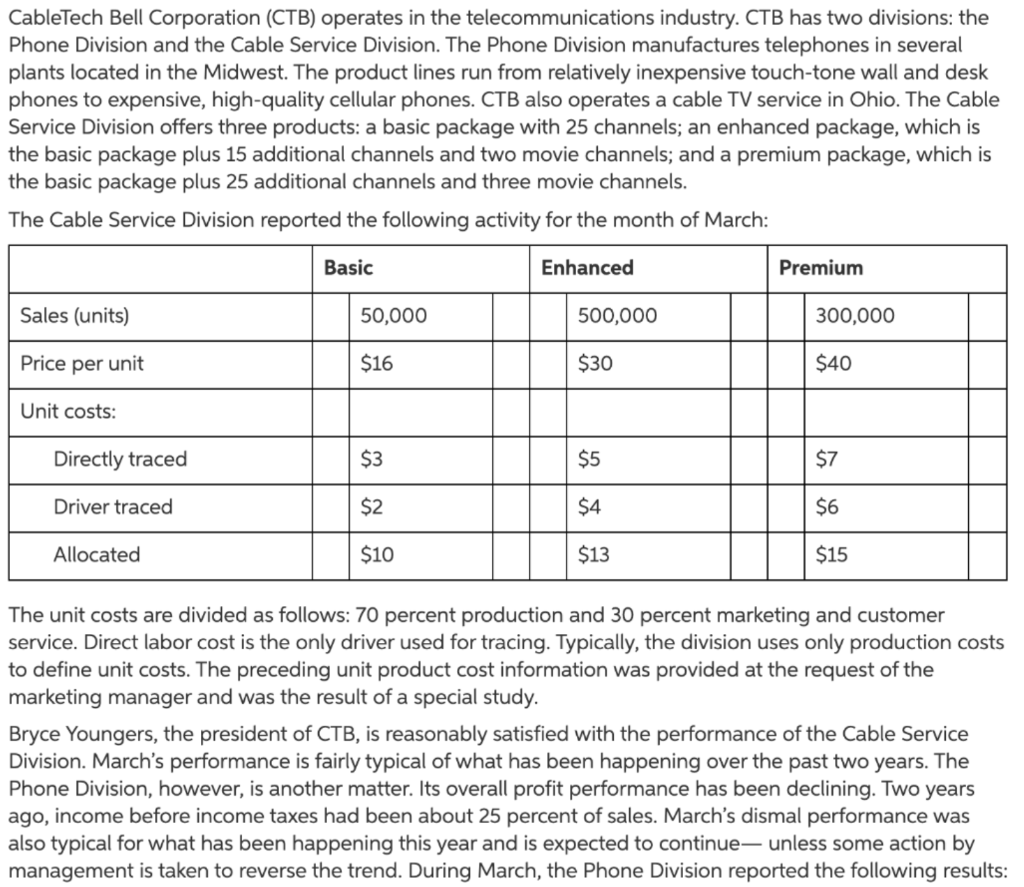
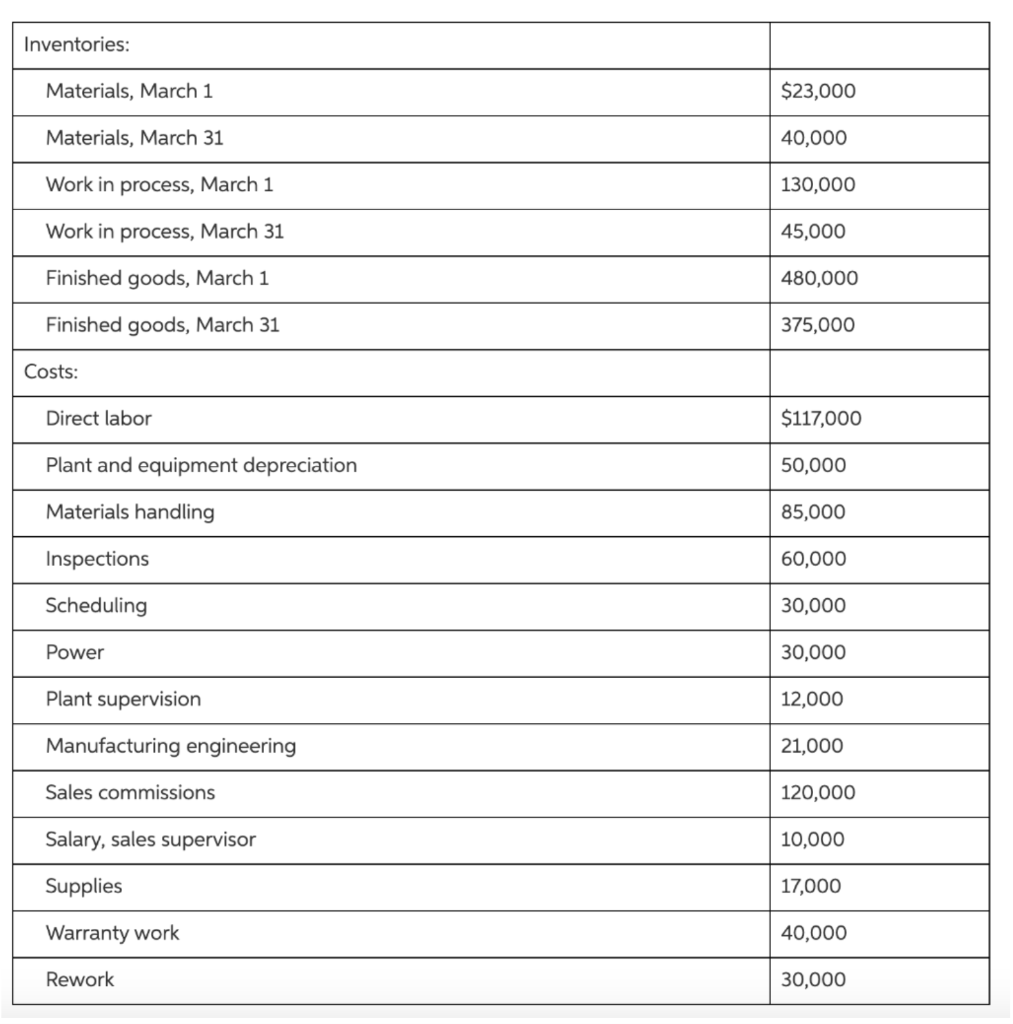
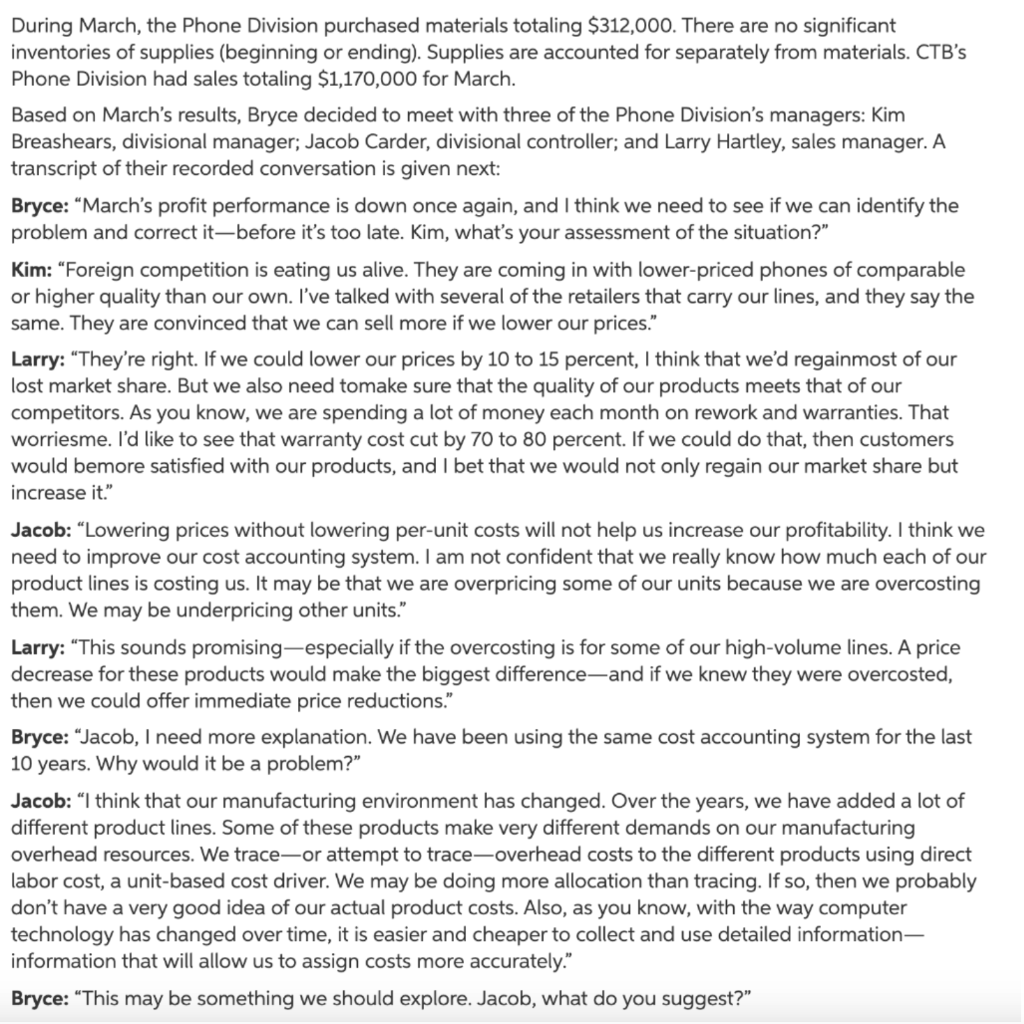
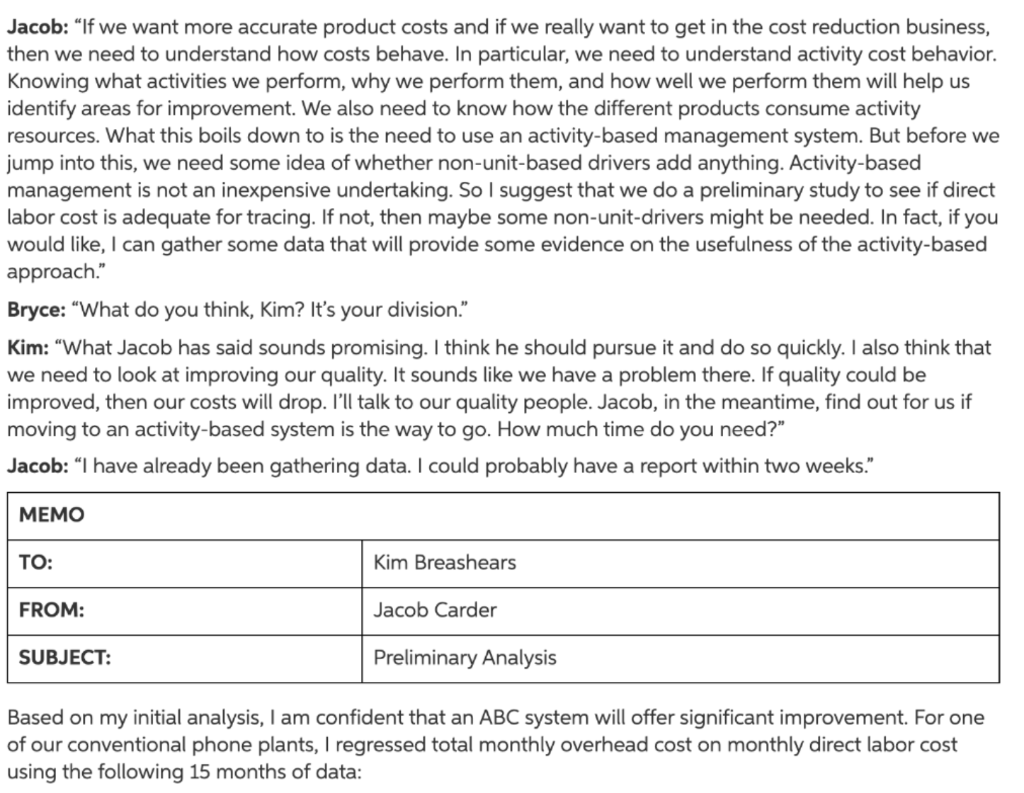
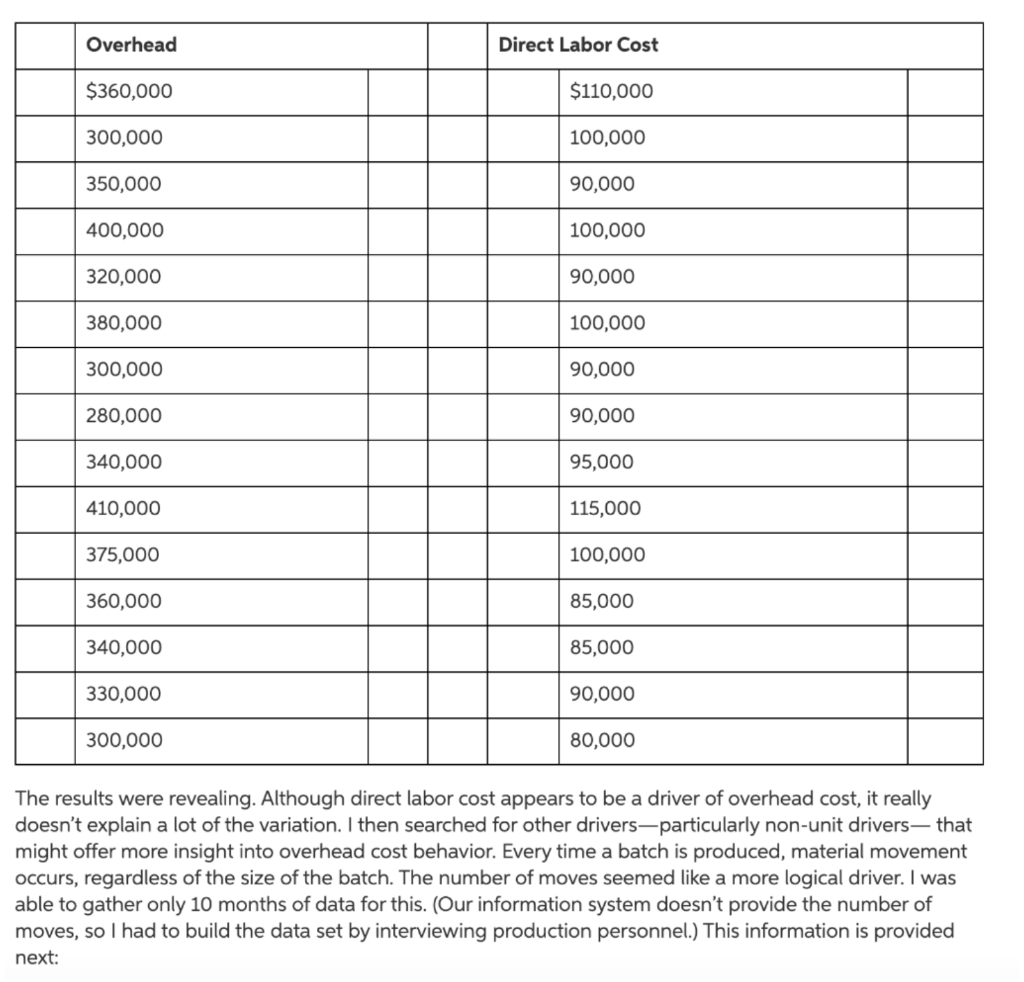
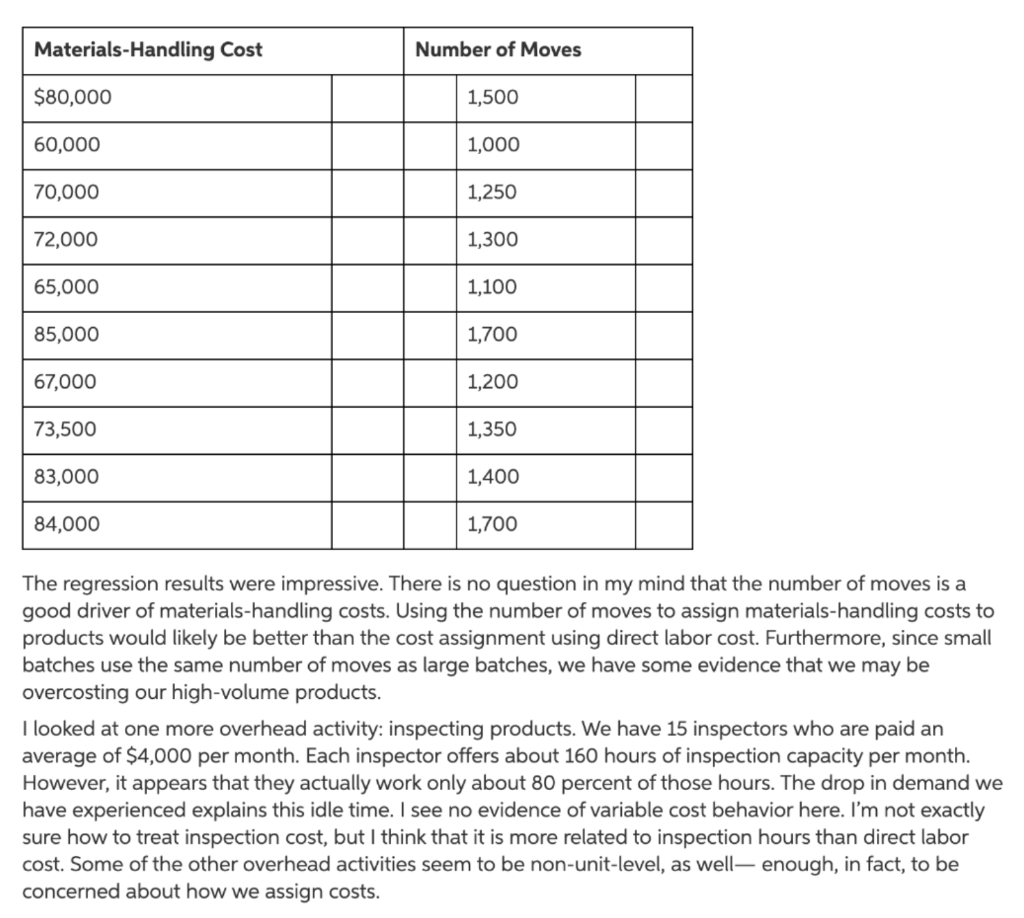
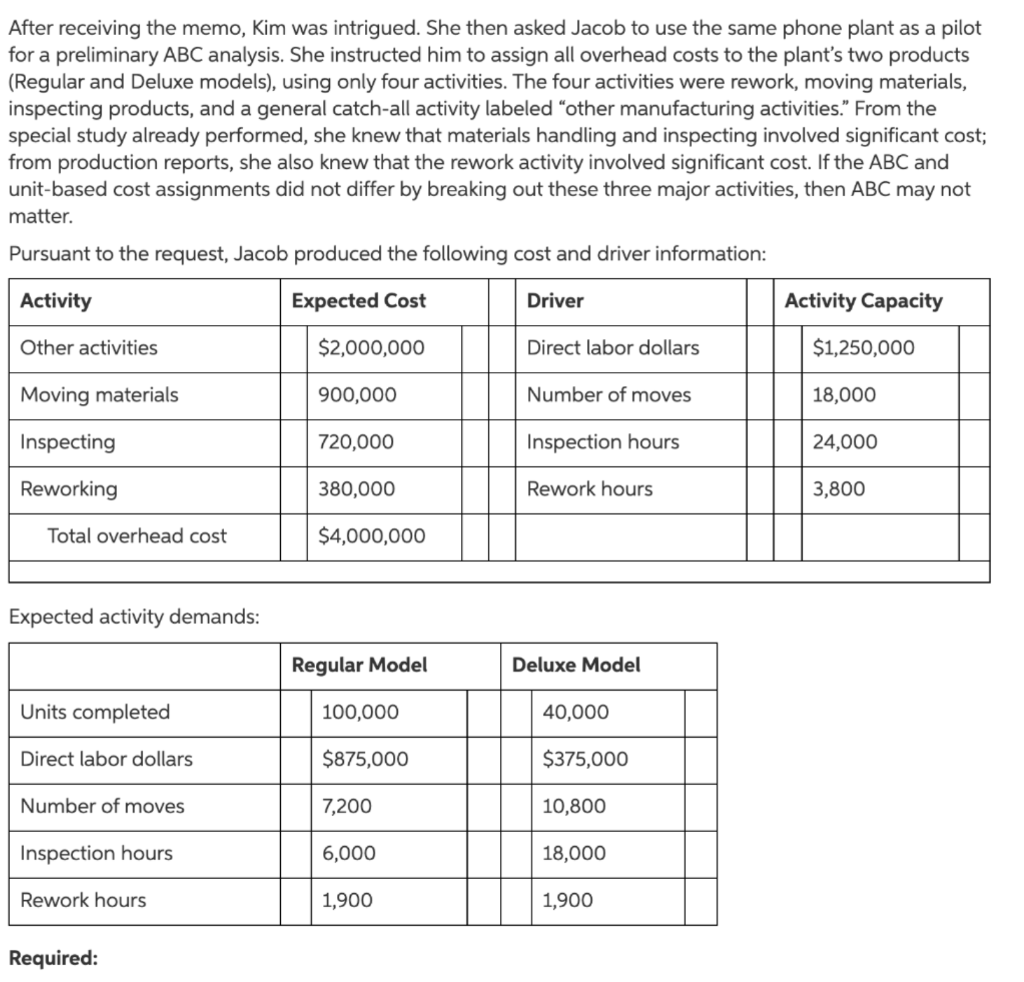
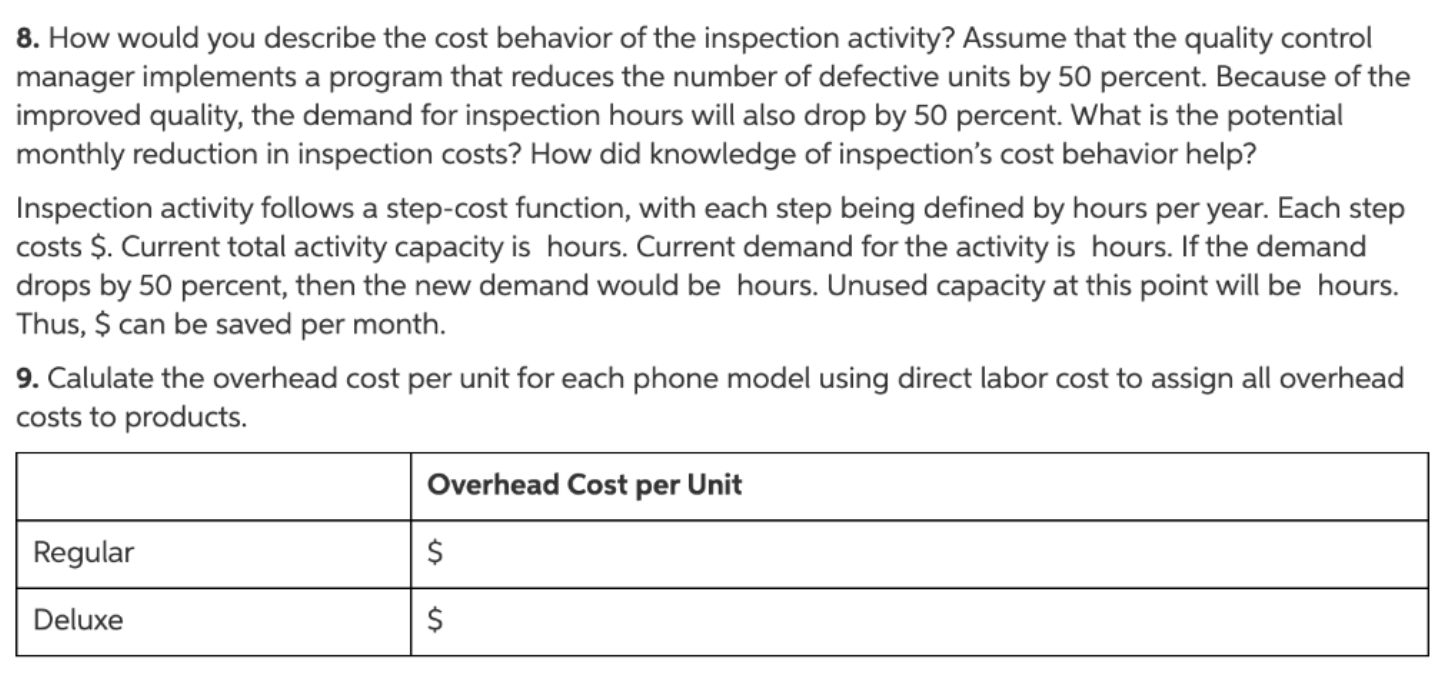
CableTech Bell Corporation (CTB) operates in the telecommunications industry. CTB has two divisions: the Phone Division and the Cable Service Division. The Phone Division manufactures telephones in several plants located in the Midwest. The product lines run from relatively inexpensive touch-tone wall and desk phones to expensive, high-quality cellular phones. CTB also operates a cable TV service in Ohio. The Cable Service Division offers three products: a basic package with 25 channels; an enhanced package, which is the basic package plus 15 additional channels and two movie channels; and a premium package, which is the basic package plus 25 additional channels and three movie channels. The Cable Service Division reported the following activity for the month of March: Basic Enhanced Premium Sales (units) 50,000 500,000 300,000 Price per unit $16 $30 $40 Unit costs: Directly traced $3 $5 $7 Driver traced $2 $4 $6 Allocated $10 $13 $15 The unit costs are divided as follows: 70 percent production and 30 percent marketing and customer service. Direct labor cost is the only driver used for tracing. Typically, the division uses only production costs to define unit costs. The preceding unit product cost information was provided at the request of the marketing manager and was the result of a special study. Bryce Youngers, the president of CTB, is reasonably satisfied with the performance of the Cable Service Division. March's performance is fairly typical of what has been happening over the past two years. The Phone Division, however, is another matter. Its overall profit performance has been declining. Two years ago, income before income taxes had been about 25 percent of sales. March's dismal performance was also typical for what has been happening this year and is expected to continue- unless some action by management is taken to reverse the trend. During March, the Phone Division reported the following results: Inventories: Materials, March 1 $23,000 Materials, March 31 40,000 Work in process, March 1 130,000 Work in process, March 31 45,000 Finished goods, March 1 480,000 Finished goods, March 31 375,000 Costs: Direct labor $117,000 Plant and equipment depreciation 50,000 Materials handling 85,000 Inspections 60,000 Scheduling 30,000 Power 30,000 Plant supervision 12,000 Manufacturing engineering 21,000 Sales commissions 120,000 Salary, sales supervisor 10,000 Supplies 17,000 Warranty work 40,000 Rework 30,000 During March, the Phone Division purchased materials totaling $312,000. There are no significant inventories of supplies (beginning or ending). Supplies are accounted for separately from materials. CTB's Phone Division had sales totaling $1,170,000 for March. Based on March's results, Bryce decided to meet with three of the Phone Division's managers: Kim Breashears, divisional manager; Jacob Carder, divisional controller; and Larry Hartley, sales manager. A transcript of their recorded conversation is given next: Bryce: March's profit performance is down once again, and I think we need to see if we can identify the problem and correct it-before it's too late. Kim, what's your assessment of the situation?" Kim: Foreign competition is eating us alive. They are coming in with lower-priced phones of comparable or higher quality than our own. I've talked with several of the retailers that carry our lines, and they say the same. They are convinced that we can sell more if we lower our prices. Larry: They're right. If we could lower our prices by 10 to 15 percent, I think that we'd regainmost of our lost market share. But we also need tomake sure that the quality of our products meets that of our competitors. As you know, we are spending a lot of money each month on rework and warranties. That worriesme. I'd like to see that warranty cost cut by 70 to 80 percent. If we could do that, then customers would bemore satisfied with our products, and I bet that we would not only regain our market share but increase it." Jacob: Lowering prices without lowering per-unit costs will not help us increase our profitability. I think we need to improve our cost accounting system. I am not confident that we really know how much each of our product lines is costing us. It may be that we are overpricing some of our units because we are overcosting them. We may be underpricing other units." Larry: This sounds promising-especially if the overcosting is for some of our high-volume lines. A price decrease for these products would make the biggest differenceand if we knew they were overcosted, then we could offer immediate price reductions. Bryce: Jacob, I need more explanation. We have been using the same cost accounting system for the last 10 years. Why would it be a problem?" Jacob: I think that our manufacturing environment has changed. Over the years, we have added a lot of different product lines. Some of these products make very different demands on our manufacturing overhead resources. We trace-or attempt to trace-overhead costs to the different products using direct labor cost, a unit-based cost driver. We may be doing more allocation than tracing. If so, then we probably don't have a very good idea of our actual product costs. Also, as you know, with the way computer technology has changed over time, it is easier and cheaper to collect and use detailed information- information that will allow us to assign costs more accurately." Bryce: This may be something we should explore. Jacob, what do you suggest? Jacob: If we want more accurate product costs and if we really want to get in the cost reduction business, then we need to understand how costs behave. In particular, we need to understand activity cost behavior. Knowing what activities we perform, why we perform them, and how well we perform them will help us identify areas for improvement. We also need to know how the different products consume activity resources. What this boils down to is the need to use an activity-based management system. But before we jump into this, we need some idea of whether non-unit-based drivers add anything. Activity-based management is not an inexpensive undertaking. So I suggest that we do a preliminary study to see if direct labor cost is adequate for tracing. If not, then maybe some non-unit-drivers might be needed. In fact, if you would like, I can gather some data that will provide some evidence on the usefulness of the activity-based approach." Bryce: What do you think, Kim? It's your division." Kim: What Jacob has said sounds promising. I think he should pursue it and do so quickly. I also think that we need to look at improving our quality. It sounds like we have a problem there. If quality could be improved, then our costs will drop. I'll talk to our quality people. Jacob, in the meantime, find out for us if moving to an activity-based system is the way to go. How much time do you need?" Jacob: I have already been gathering data. I could probably have a report within two weeks. MEMO TO: Kim Breashears FROM: Jacob Carder SUBJECT: Preliminary Analysis Based on my initial analysis, I am confident that an ABC system will offer significant improvement. For one of our conventional phone plants, I regressed total monthly overhead cost on monthly direct labor cost using the following 15 months of data: Overhead Direct Labor Cost $360,000 $110,000 300,000 100,000 350,000 90,000 400,000 100,000 320,000 90,000 380,000 100,000 300,000 90,000 280,000 90,000 340,000 95,000 410,000 115,000 375,000 100,000 360,000 85,000 340,000 85,000 330,000 90,000 300,000 80,000 The results were revealing. Although direct labor cost appears to be a driver of overhead cost, it really doesn't explain a lot of the variation. I then searched for other drivers-particularly non-unit drivers- that might offer more insight into overhead cost behavior. Every time a batch is produced, material movement occurs, regardless of the size of the batch. The number of moves seemed like a more logical driver. I was able to gather only 10 months of data for this. (Our information system doesn't provide the number of moves, so I had to build the data set by interviewing production personnel.) This information is provided next: Materials-Handling Cost Number of Moves $80,000 1,500 60,000 1,000 70,000 1,250 72,000 1,300 65,000 1,100 85,000 1,700 67,000 1,200 73,500 1,350 83,000 1,400 84,000 1,700 The regression results were impressive. There is no question in my mind that the number of moves is a good driver of materials-handling costs. Using the number of moves to assign materials-handling costs to products would likely be better than the cost assignment using direct labor cost. Furthermore, since small batches use the same number of moves as large batches, we have some evidence that we may be overcosting our high-volume products. I looked at one more overhead activity: inspecting products. We have 15 inspectors who are paid an average of $4,000 per month. Each inspector offers about 160 hours of inspection capacity per month. However, it appears that they actually work only about 80 percent of those hours. The drop in demand we have experienced explains this idle time. I see no evidence of variable cost behavior here. I'm not exactly sure how to treat inspection cost, but I think that it is more related to inspection hours than direct labor cost. Some of the other overhead activities seem to be non-unit-level, as well - enough, in fact, to be concerned about how we assign costs. After receiving the memo, Kim was intrigued. She then asked Jacob to use the same phone plant as a pilot for a preliminary ABC analysis. She instructed him to assign all overhead costs to the plant's two products (Regular and Deluxe models), using only four activities. The four activities were rework, moving materials, inspecting products, and a general catch-all activity labeled "other manufacturing activities. From the special study already performed, she knew that materials handling and inspecting involved significant cost; from production reports, she also knew that the rework activity involved significant cost. If the ABC and unit-based cost assignments did not differ by breaking out these three major activities, then ABC may not matter. Pursuant to the request, Jacob produced the following cost and driver information: Activity Expected Cost Driver Activity Capacity Other activities $2,000,000 Direct labor dollars $1,250,000 Moving materials 900,000 Number of moves 18,000 Inspecting 720,000 Inspection hours 24,000 Reworking 380,000 Rework hours 3,800 Total overhead cost $4,000,000 Expected activity demands: Regular Model Deluxe Model Units completed 100,000 40,000 Direct labor dollars $875,000 $375,000 Number of moves 7,200 10,800 Inspection hours 6,000 18,000 Rework hours 1,900 1,900 Required: 8. How would you describe the cost behavior of the inspection activity? Assume that the quality control manager implements a program that reduces the number of defective units by 50 percent. Because of the improved quality, the demand for inspection hours will also drop by 50 percent. What is the potential monthly reduction in inspection costs? How did knowledge of inspection's cost behavior help? Inspection activity follows a step-cost function, with each step being defined by hours per year. Each step costs $. Current total activity capacity is hours. Current demand for the activity is hours. If the demand drops by 50 percent, then the new demand would be hours. Unused capacity at this point will be hours. Thus, $ can be saved per month. 9. Calulate the overhead cost per unit for each phone model using direct labor cost to assign all overhead costs to products. Overhead Cost per Unit Regular $ Deluxe $ CableTech Bell Corporation (CTB) operates in the telecommunications industry. CTB has two divisions: the Phone Division and the Cable Service Division. The Phone Division manufactures telephones in several plants located in the Midwest. The product lines run from relatively inexpensive touch-tone wall and desk phones to expensive, high-quality cellular phones. CTB also operates a cable TV service in Ohio. The Cable Service Division offers three products: a basic package with 25 channels; an enhanced package, which is the basic package plus 15 additional channels and two movie channels; and a premium package, which is the basic package plus 25 additional channels and three movie channels. The Cable Service Division reported the following activity for the month of March: Basic Enhanced Premium Sales (units) 50,000 500,000 300,000 Price per unit $16 $30 $40 Unit costs: Directly traced $3 $5 $7 Driver traced $2 $4 $6 Allocated $10 $13 $15 The unit costs are divided as follows: 70 percent production and 30 percent marketing and customer service. Direct labor cost is the only driver used for tracing. Typically, the division uses only production costs to define unit costs. The preceding unit product cost information was provided at the request of the marketing manager and was the result of a special study. Bryce Youngers, the president of CTB, is reasonably satisfied with the performance of the Cable Service Division. March's performance is fairly typical of what has been happening over the past two years. The Phone Division, however, is another matter. Its overall profit performance has been declining. Two years ago, income before income taxes had been about 25 percent of sales. March's dismal performance was also typical for what has been happening this year and is expected to continue- unless some action by management is taken to reverse the trend. During March, the Phone Division reported the following results: Inventories: Materials, March 1 $23,000 Materials, March 31 40,000 Work in process, March 1 130,000 Work in process, March 31 45,000 Finished goods, March 1 480,000 Finished goods, March 31 375,000 Costs: Direct labor $117,000 Plant and equipment depreciation 50,000 Materials handling 85,000 Inspections 60,000 Scheduling 30,000 Power 30,000 Plant supervision 12,000 Manufacturing engineering 21,000 Sales commissions 120,000 Salary, sales supervisor 10,000 Supplies 17,000 Warranty work 40,000 Rework 30,000 During March, the Phone Division purchased materials totaling $312,000. There are no significant inventories of supplies (beginning or ending). Supplies are accounted for separately from materials. CTB's Phone Division had sales totaling $1,170,000 for March. Based on March's results, Bryce decided to meet with three of the Phone Division's managers: Kim Breashears, divisional manager; Jacob Carder, divisional controller; and Larry Hartley, sales manager. A transcript of their recorded conversation is given next: Bryce: March's profit performance is down once again, and I think we need to see if we can identify the problem and correct it-before it's too late. Kim, what's your assessment of the situation?" Kim: Foreign competition is eating us alive. They are coming in with lower-priced phones of comparable or higher quality than our own. I've talked with several of the retailers that carry our lines, and they say the same. They are convinced that we can sell more if we lower our prices. Larry: They're right. If we could lower our prices by 10 to 15 percent, I think that we'd regainmost of our lost market share. But we also need tomake sure that the quality of our products meets that of our competitors. As you know, we are spending a lot of money each month on rework and warranties. That worriesme. I'd like to see that warranty cost cut by 70 to 80 percent. If we could do that, then customers would bemore satisfied with our products, and I bet that we would not only regain our market share but increase it." Jacob: Lowering prices without lowering per-unit costs will not help us increase our profitability. I think we need to improve our cost accounting system. I am not confident that we really know how much each of our product lines is costing us. It may be that we are overpricing some of our units because we are overcosting them. We may be underpricing other units." Larry: This sounds promising-especially if the overcosting is for some of our high-volume lines. A price decrease for these products would make the biggest differenceand if we knew they were overcosted, then we could offer immediate price reductions. Bryce: Jacob, I need more explanation. We have been using the same cost accounting system for the last 10 years. Why would it be a problem?" Jacob: I think that our manufacturing environment has changed. Over the years, we have added a lot of different product lines. Some of these products make very different demands on our manufacturing overhead resources. We trace-or attempt to trace-overhead costs to the different products using direct labor cost, a unit-based cost driver. We may be doing more allocation than tracing. If so, then we probably don't have a very good idea of our actual product costs. Also, as you know, with the way computer technology has changed over time, it is easier and cheaper to collect and use detailed information- information that will allow us to assign costs more accurately." Bryce: This may be something we should explore. Jacob, what do you suggest? Jacob: If we want more accurate product costs and if we really want to get in the cost reduction business, then we need to understand how costs behave. In particular, we need to understand activity cost behavior. Knowing what activities we perform, why we perform them, and how well we perform them will help us identify areas for improvement. We also need to know how the different products consume activity resources. What this boils down to is the need to use an activity-based management system. But before we jump into this, we need some idea of whether non-unit-based drivers add anything. Activity-based management is not an inexpensive undertaking. So I suggest that we do a preliminary study to see if direct labor cost is adequate for tracing. If not, then maybe some non-unit-drivers might be needed. In fact, if you would like, I can gather some data that will provide some evidence on the usefulness of the activity-based approach." Bryce: What do you think, Kim? It's your division." Kim: What Jacob has said sounds promising. I think he should pursue it and do so quickly. I also think that we need to look at improving our quality. It sounds like we have a problem there. If quality could be improved, then our costs will drop. I'll talk to our quality people. Jacob, in the meantime, find out for us if moving to an activity-based system is the way to go. How much time do you need?" Jacob: I have already been gathering data. I could probably have a report within two weeks. MEMO TO: Kim Breashears FROM: Jacob Carder SUBJECT: Preliminary Analysis Based on my initial analysis, I am confident that an ABC system will offer significant improvement. For one of our conventional phone plants, I regressed total monthly overhead cost on monthly direct labor cost using the following 15 months of data: Overhead Direct Labor Cost $360,000 $110,000 300,000 100,000 350,000 90,000 400,000 100,000 320,000 90,000 380,000 100,000 300,000 90,000 280,000 90,000 340,000 95,000 410,000 115,000 375,000 100,000 360,000 85,000 340,000 85,000 330,000 90,000 300,000 80,000 The results were revealing. Although direct labor cost appears to be a driver of overhead cost, it really doesn't explain a lot of the variation. I then searched for other drivers-particularly non-unit drivers- that might offer more insight into overhead cost behavior. Every time a batch is produced, material movement occurs, regardless of the size of the batch. The number of moves seemed like a more logical driver. I was able to gather only 10 months of data for this. (Our information system doesn't provide the number of moves, so I had to build the data set by interviewing production personnel.) This information is provided next: Materials-Handling Cost Number of Moves $80,000 1,500 60,000 1,000 70,000 1,250 72,000 1,300 65,000 1,100 85,000 1,700 67,000 1,200 73,500 1,350 83,000 1,400 84,000 1,700 The regression results were impressive. There is no question in my mind that the number of moves is a good driver of materials-handling costs. Using the number of moves to assign materials-handling costs to products would likely be better than the cost assignment using direct labor cost. Furthermore, since small batches use the same number of moves as large batches, we have some evidence that we may be overcosting our high-volume products. I looked at one more overhead activity: inspecting products. We have 15 inspectors who are paid an average of $4,000 per month. Each inspector offers about 160 hours of inspection capacity per month. However, it appears that they actually work only about 80 percent of those hours. The drop in demand we have experienced explains this idle time. I see no evidence of variable cost behavior here. I'm not exactly sure how to treat inspection cost, but I think that it is more related to inspection hours than direct labor cost. Some of the other overhead activities seem to be non-unit-level, as well - enough, in fact, to be concerned about how we assign costs. After receiving the memo, Kim was intrigued. She then asked Jacob to use the same phone plant as a pilot for a preliminary ABC analysis. She instructed him to assign all overhead costs to the plant's two products (Regular and Deluxe models), using only four activities. The four activities were rework, moving materials, inspecting products, and a general catch-all activity labeled "other manufacturing activities. From the special study already performed, she knew that materials handling and inspecting involved significant cost; from production reports, she also knew that the rework activity involved significant cost. If the ABC and unit-based cost assignments did not differ by breaking out these three major activities, then ABC may not matter. Pursuant to the request, Jacob produced the following cost and driver information: Activity Expected Cost Driver Activity Capacity Other activities $2,000,000 Direct labor dollars $1,250,000 Moving materials 900,000 Number of moves 18,000 Inspecting 720,000 Inspection hours 24,000 Reworking 380,000 Rework hours 3,800 Total overhead cost $4,000,000 Expected activity demands: Regular Model Deluxe Model Units completed 100,000 40,000 Direct labor dollars $875,000 $375,000 Number of moves 7,200 10,800 Inspection hours 6,000 18,000 Rework hours 1,900 1,900 Required: 8. How would you describe the cost behavior of the inspection activity? Assume that the quality control manager implements a program that reduces the number of defective units by 50 percent. Because of the improved quality, the demand for inspection hours will also drop by 50 percent. What is the potential monthly reduction in inspection costs? How did knowledge of inspection's cost behavior help? Inspection activity follows a step-cost function, with each step being defined by hours per year. Each step costs $. Current total activity capacity is hours. Current demand for the activity is hours. If the demand drops by 50 percent, then the new demand would be hours. Unused capacity at this point will be hours. Thus, $ can be saved per month. 9. Calulate the overhead cost per unit for each phone model using direct labor cost to assign all overhead costs to products. Overhead Cost per Unit Regular $ Deluxe $
Step by Step Solution
There are 3 Steps involved in it

Get step-by-step solutions from verified subject matter experts