

Question: Please Label each part(y, forecasted sales, etc) in your solution. If you plan on writing you solution please make it legible. TY in advance! Mark
Please Label each part(y, forecasted sales, etc) in your solution. If you plan on writing you solution please make it legible. TY in advance!
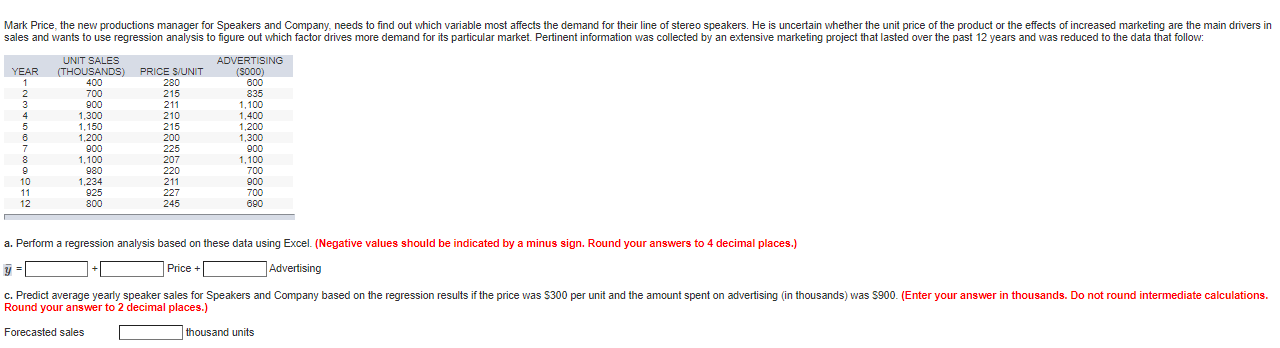
Mark Price, the new productions manager for Speakers and Company, needs to find out which variable most affects the demand for their line of stereo speakers. He is uncertain whether the unit price of the product or the effects of increased marketing are the main drivers in sales and wants to use regression analysis to figure out which factor drives more demand for its particular market. Pertinent information was collected by an extensive marketing project that lasted over the past 12 years and was reduced to the data that follow: UNIT SALES ADVERTISING YEAR (THOUSANDS) PRICE S/UNIT (5000) 1 1 400 280 600 2 2 700 215 835 3 900 211 1,100 1,300 210 1,400 5 1,150 215 1,200 6 1,200 200 1,300 7 900 900 8 1.100 207 1.100 9 980 700 10 1,234 900 925 227 700 12 800 245 690 4 225 220 211 11 a. Perform a regression analysis based on these data using Excel. (Negative values should be indicated by a minus sign. Round your answers to 4 decimal places.) ya Price + Advertising C. Predict average yearly speaker sales for Speakers and Company based on the regression results if the price was $300 per unit and the amount spent on advertising (in thousands) was 900 (Enter your answer in thousands. Do not round intermediate calculations. Round your answer to 2 decimal places.) Forecasted sales thousand unitsStep by Step Solution
There are 3 Steps involved in it
1 Expert Approved Answer
Step: 1 Unlock

Question Has Been Solved by an Expert!
Get step-by-step solutions from verified subject matter experts
Step: 2 Unlock
Step: 3 Unlock