

Question: Please label each section. Please HELP, answer Below ( Label/ seperate each section) Hypothesis test for a mean ('earnings variable) State the assumptions for this
Please label each section.
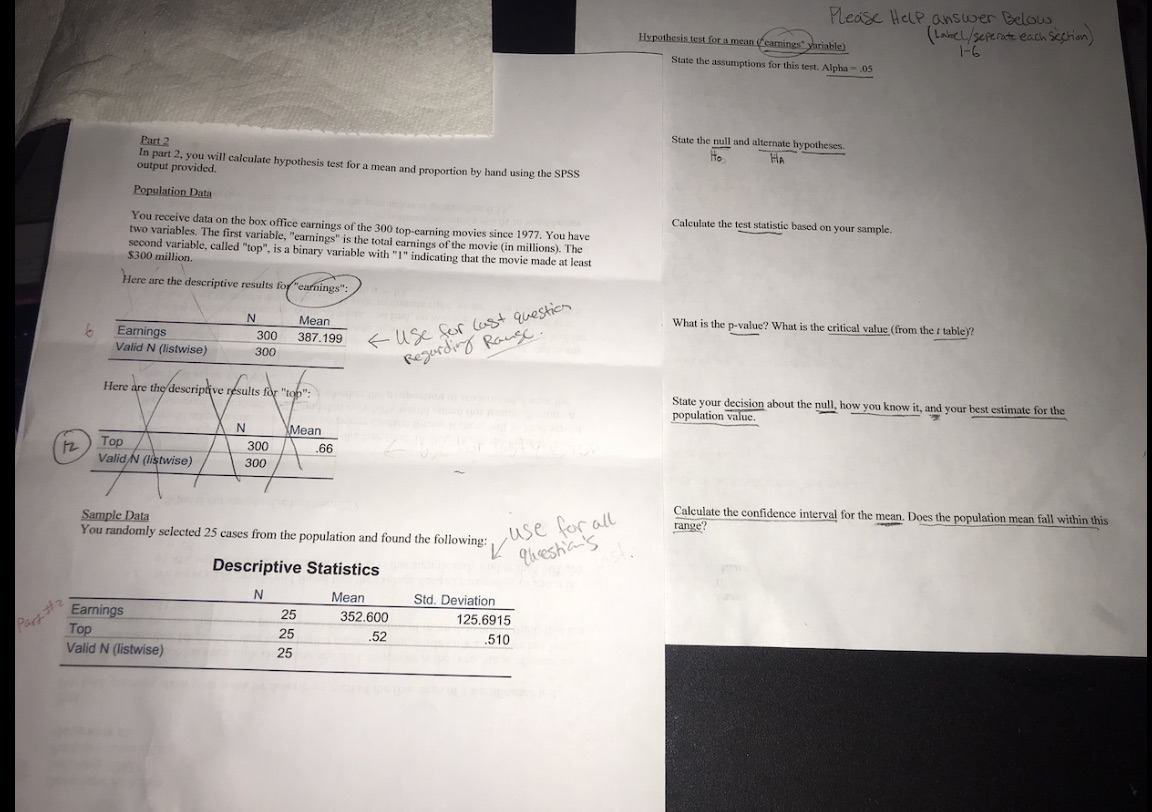
Please HELP, answer Below ( Label/ seperate each section) Hypothesis test for a mean ('earnings" variable) State the assumptions for this test. Alpha - .05 State the null and alternate hypotheses. Part 2 Ho HA output provided. In part 2, you will calculate hypothesis test for a mean and proportion by hand using the SPSS Population Data Calculate the test statistic based on your sample. You receive data on the box office earnings of the 300 top-earning movies since 1977. You have two variables. The first variable, "earnings" is the total earnings of the movie (in millions). The second variable, called "top", is a binary variable with "I" indicating that the movie made at least $300 million Here are the descriptive results for "earnings": N F use for last question What is the p-value? What is the critical value (from the : table)? Earnings 300 387.199 Regarding Rause. Valid N (listwise) 300 Here are the descriptive results for "tob": State your decision about the null, how you know it, and your best estimate for the population value. N Mean 12 Top 300 .66 Valid/N (listwise) 300 Calculate the confidence interval for the mean. Does the population mean fall within this Sample Data use for all range? You randomly selected 25 cases from the population and found the following: question's Descriptive Statistics Mean Std. Deviation Earnings 25 352.600 125.6915 Part# Top 25 52 .510 Valid N (listwise) 25
Step by Step Solution
There are 3 Steps involved in it

Get step-by-step solutions from verified subject matter experts