

Question: Please let me know what information is missing Hi, can you please do this with working out and also send me the working out? Bend
Please let me know what information is missing
Hi,
can you please do this with working out and also send me the working out?
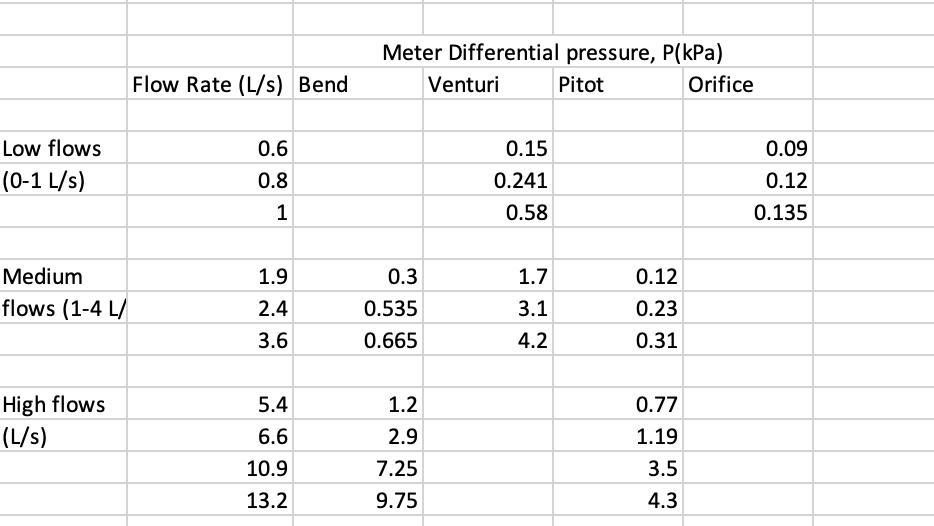
Bend = D = 70 mm
Venturi meter = D1 = 70 mm, D2 = 35 mm
Pitot tube = D = 70 mm
Orifice = D1 = 0 mm, D2 = 25 mm
Thanks
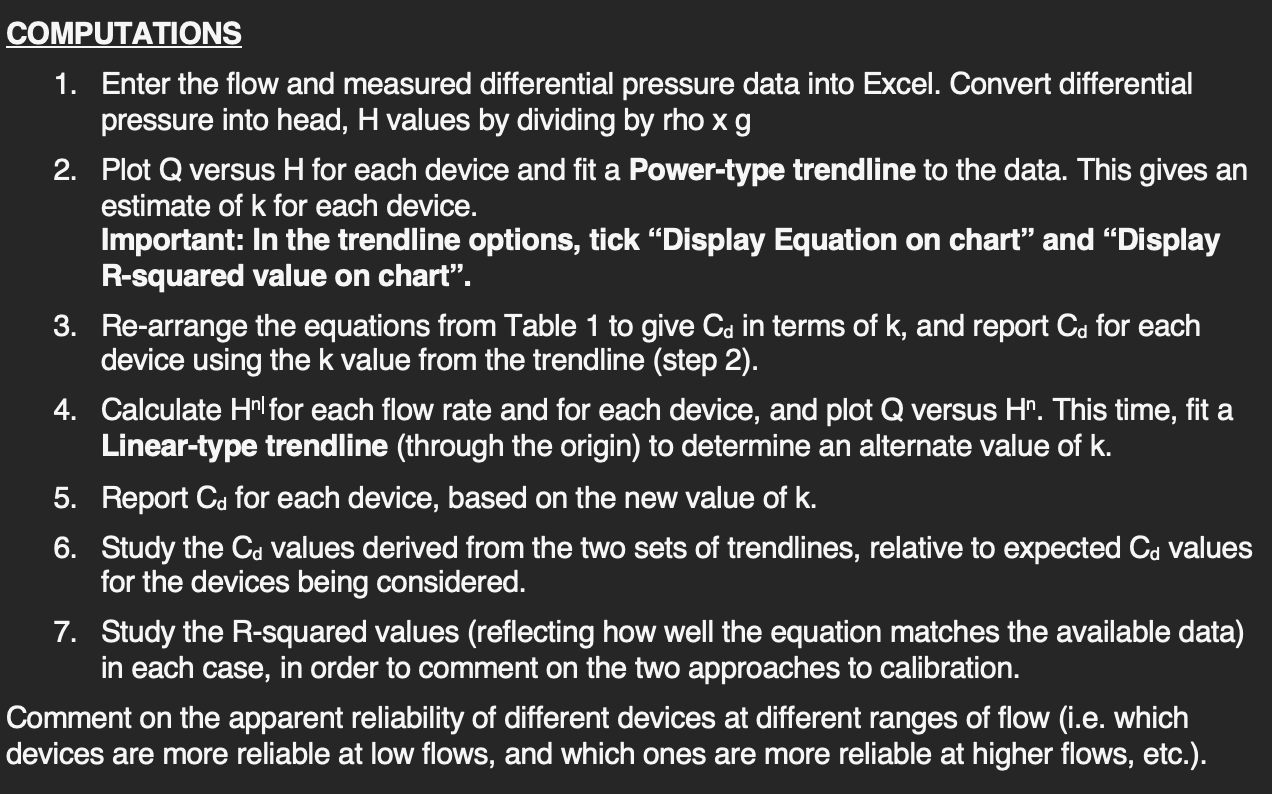
1. Enter the flow and measured differential pressure data into Excel. Convert differential pressure into head, H values by dividing by rho xg 2. Plot Q versus H for each device and fit a Power-type trendline to the data. This gives an estimate of k for each device. Important: In the trendline options, tick "Display Equation on chart" and "Display R-squared value on chart". 3. Re-arrange the equations from Table 1 to give Cd in terms of k, and report Cd for each device using the k value from the trendline (step 2). 4. Calculate Hn for each flow rate and for each device, and plot Q versus Hn. This time, fit a Linear-type trendline (through the origin) to determine an alternate value of k. 5. Report Cd for each device, based on the new value of k. 6. Study the Cd values derived from the two sets of trendlines, relative to expected Cd values for the devices being considered. 7. Study the R-squared values (reflecting how well the equation matches the available data) in each case, in order to comment on the two approaches to calibration. Comment on the apparent reliability of different devices at different ranges of flow (i.e. which levices are more reliable at low flows, and which ones are more reliable at higher flows, etc.). 1. Enter the flow and measured differential pressure data into Excel. Convert differential pressure into head, H values by dividing by rho xg 2. Plot Q versus H for each device and fit a Power-type trendline to the data. This gives an estimate of k for each device. Important: In the trendline options, tick "Display Equation on chart" and "Display R-squared value on chart". 3. Re-arrange the equations from Table 1 to give Cd in terms of k, and report Cd for each device using the k value from the trendline (step 2). 4. Calculate Hn for each flow rate and for each device, and plot Q versus Hn. This time, fit a Linear-type trendline (through the origin) to determine an alternate value of k. 5. Report Cd for each device, based on the new value of k. 6. Study the Cd values derived from the two sets of trendlines, relative to expected Cd values for the devices being considered. 7. Study the R-squared values (reflecting how well the equation matches the available data) in each case, in order to comment on the two approaches to calibration. Comment on the apparent reliability of different devices at different ranges of flow (i.e. which levices are more reliable at low flows, and which ones are more reliable at higher flows, etc.)
Step by Step Solution
There are 3 Steps involved in it

Get step-by-step solutions from verified subject matter experts