

Question: Please let me know where the answer should be placed by the number row 1 PJAM = $500,000 Most Recent Year 2 Chapter 7: Planning
Please let me know where the answer should be placed by the number row 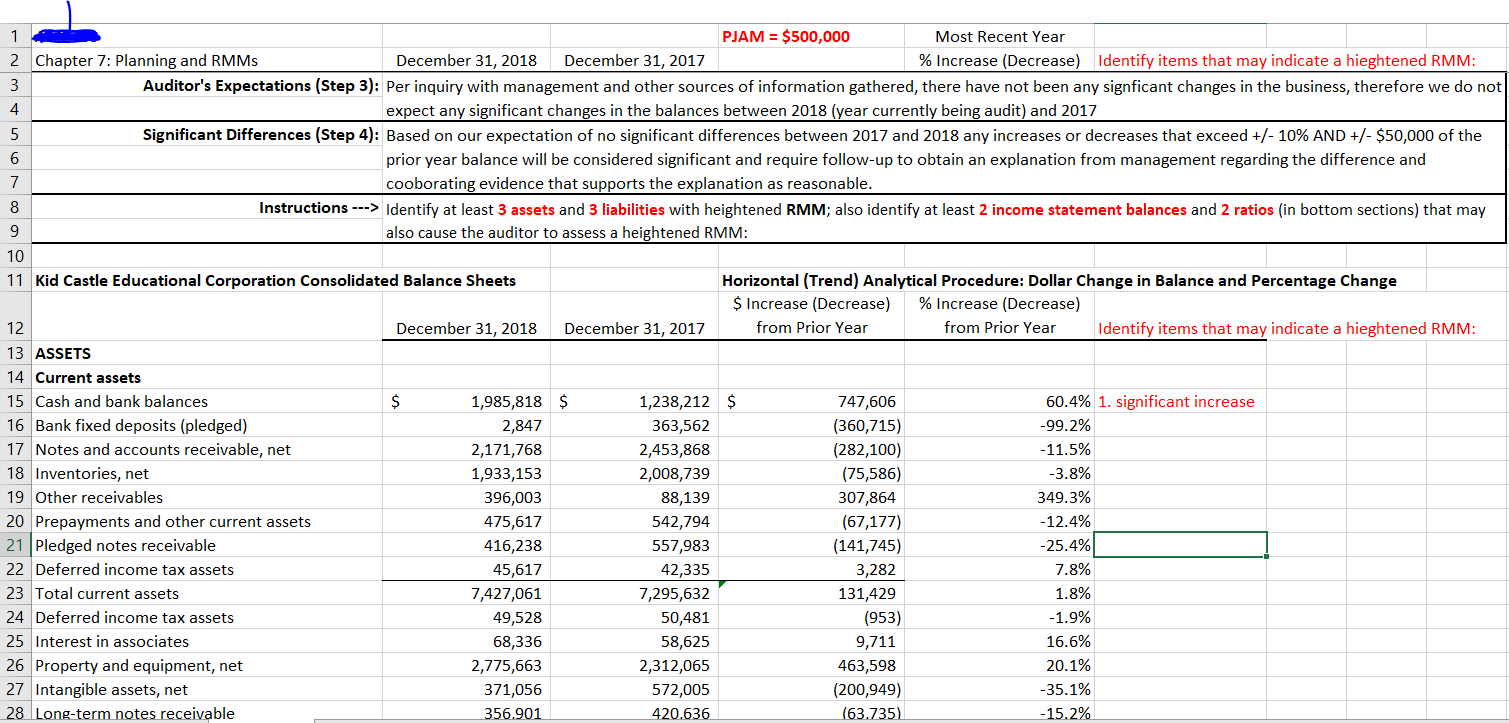
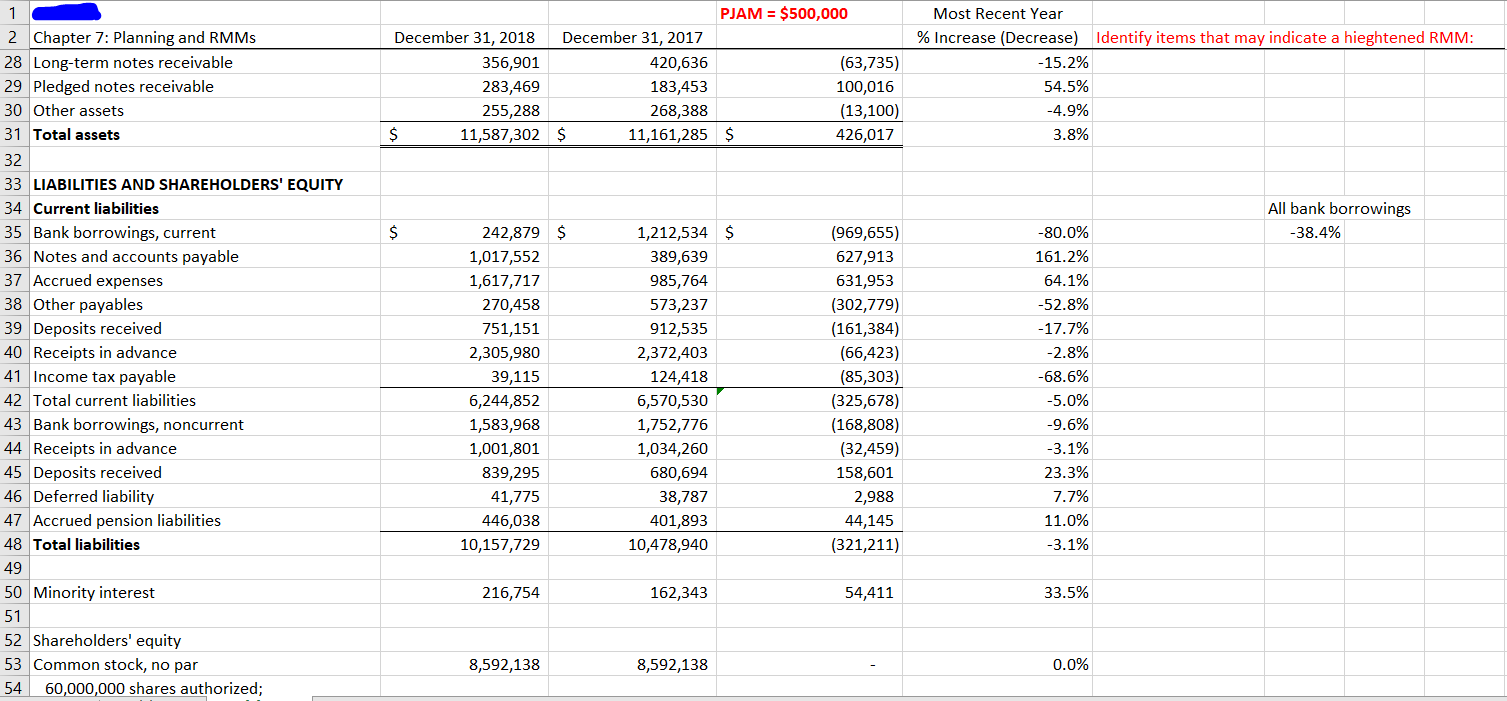
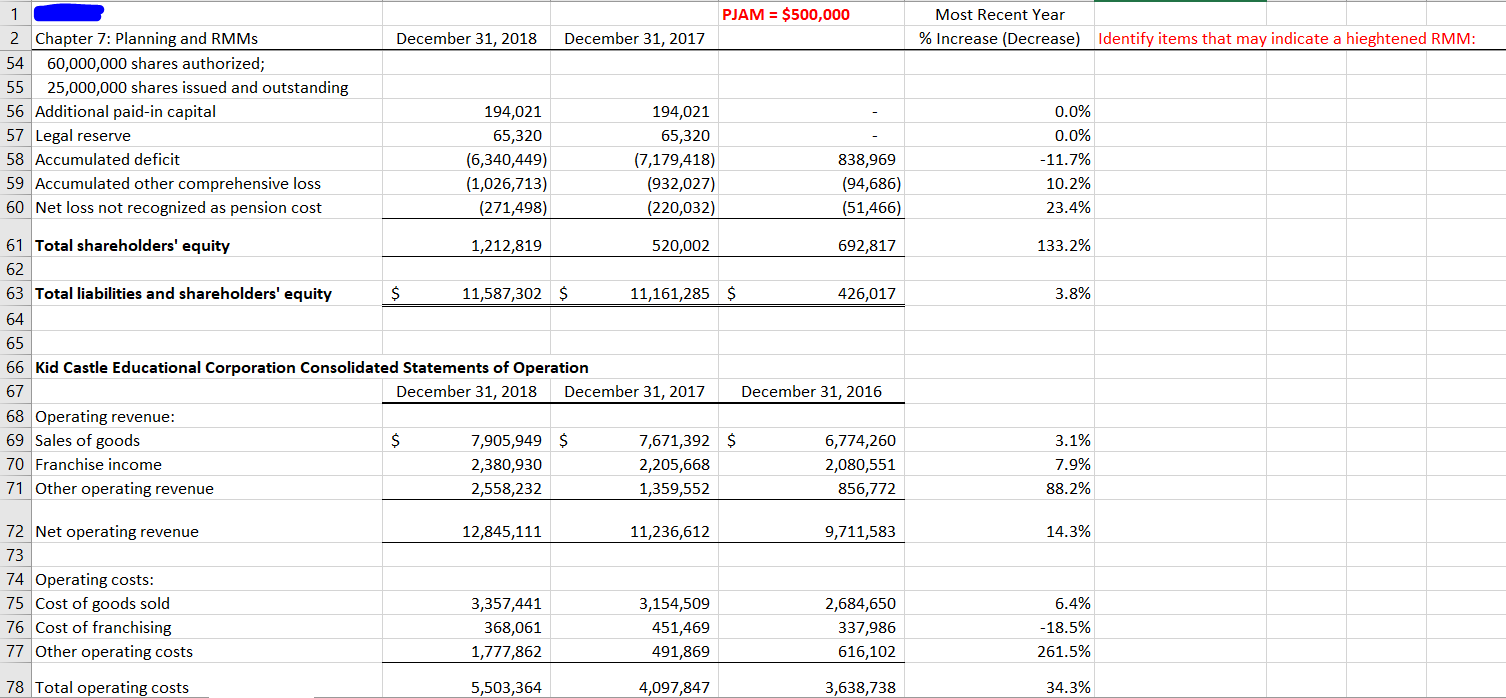
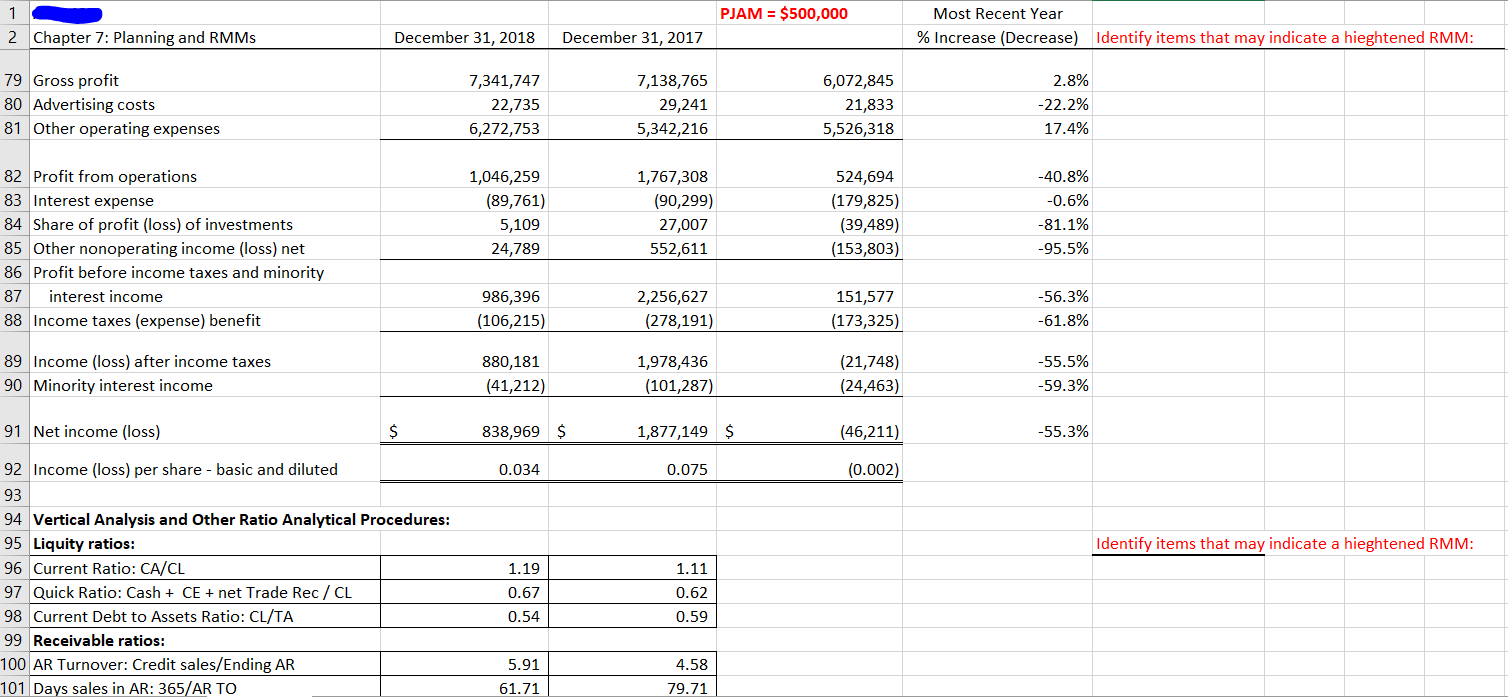

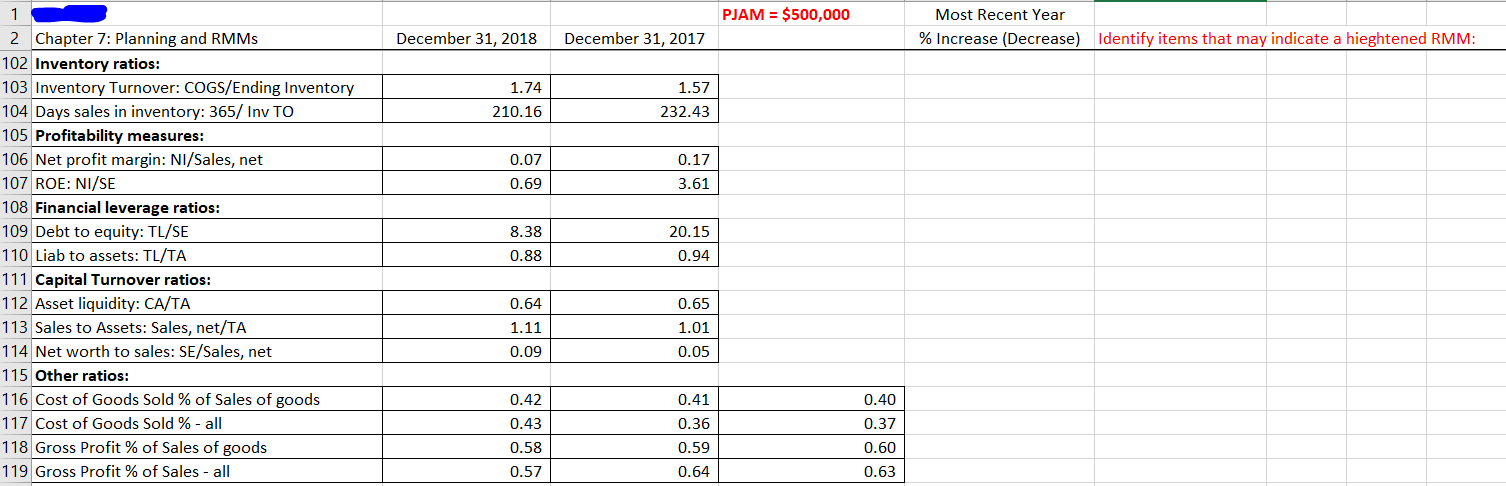
1 PJAM = $500,000 Most Recent Year 2 Chapter 7: Planning and RMMs December 31, 2018 December 31, 2017 % Increase (Decrease) Identify items that may indicate a hieghtened RMM: 3 Auditor's Expectations (Step 3): Per inquiry with management and other sources of information gathered, there have not been any signficant changes in the business, therefore we do not 4 expect any significant changes in the balances between 2018 (year currently being audit) and 2017 5 Significant Differences (Step 4): Based on our expectation of no significant differences between 2017 and 2018 any increases or decreases that exceed +/- 10% AND +/- $50,000 of the 6 prior year balance will be considered significant and require follow-up to obtain an explanation from management regarding the difference and 7 cooborating evidence that supports the explanation as reasonable. 8 Instructions ---> Identify at least 3 assets and 3 liabilities with heightened RMM; also identify at least 2 income statement balances and 2 ratios (in bottom sections) that may 9 also cause the auditor to assess a heightened RMM: 10 11 Kid Castle Educational Corporation Consolidated Balance Sheets Horizontal (Trend) Analytical Procedure: Dollar Change in Balance and Percentage Change $ Increase (Decrease) % Increase (Decrease) 12 December 31, 2018 December 31, 2017 from Prior Year from Prior Year Identify items that may indicate a hieghtened RMM: 13 ASSETS 14 Current assets 15 Cash and bank balances $ 1,985,818 $ 1,238,212 $ 747,606 60.4% 1. significant increase 16 Bank fixed deposits (pledged) 2,847 363,562 (360,715) -99.2% 17 Notes and accounts receivable, net 2,171,768 2,453,868 (282,100) -11.5% 18 Inventories, net 1,933,153 2,008,739 (75,586) -3.8% 19 Other receivables 396,003 88,139 307,864 349.3% 20 Prepayments and other current assets 475,617 542,794 (67,177) -12.4% 21 Pledged notes receivable 416,238 557,983 (141,745) -25.4% 22 Deferred income tax assets 45,617 42,335 3,282 7.8% 23 Total current assets 7,427,061 7,295,632 131,429 1.8% 24 Deferred income tax assets 49,528 50,481 (953) -1.9% 25 Interest in associates 68,336 58,625 9,711 16.6% 26 Property and equipment, net 2,775,663 2,312,065 463,598 20.1% 27 Intangible assets, net 371,056 572,005 (200,949) -35.1% 28 Long-term notes receivable 356.901 420.636 (63.735) -15.2% PJAM = $500,000 December 31, 2018 December 31, 2017 356,901 420,636 (63,735) 283,469 183,453 100,016 255,288 268,388 (13,100) $ 11,587,302 $ 11,161,285 $ 426,017 Most Recent Year % Increase (Decrease) Identify items that may indicate a hieghtened RMM: -15.2% 54.5% -4.9% 3.8% All bank borrowings -38.4% $ 1 2 Chapter 7: Planning and RMMS 28 Long-term notes receivable 29 Pledged notes receivable 30 Other assets 31 Total assets 32 33 LIABILITIES AND SHAREHOLDERS' EQUITY 34 Current liabilities 35 Bank borrowings, current 36 Notes and accounts payable 37 Accrued expenses 38 Other payables 39 Deposits received 40 Receipts in advance 41 Income tax payable 42 Total current liabilities 43 Bank borrowings, noncurrent 44 Receipts in advance 45 Deposits received 46 Deferred liability 47 Accrued pension liabilities 48 Total liabilities 49 50 Minority interest 51 52 Shareholders' equity 53 Common stock, no par 54 60,000,000 shares authorized; 242,879 $ 1,017,552 1,617,717 270,458 751,151 2,305,980 39,115 6,244,852 1,583,968 1,001,801 839,295 41,775 446,038 10,157,729 1,212,534 $ 389,639 985,764 573,237 912,535 2,372,403 124,418 6,570,530 1,752,776 1,034,260 680,694 38,787 401,893 10,478,940 (969,655) 627,913 631,953 (302,779) (161,384) (66,423) (85,303) (325,678) (168,808) (32,459) 158,601 2,988 44,145 (321,211) -80.0% 161.2% 64.1% -52.8% -17.7% -2.8% -68.6% -5.0% -9.6% -3.1% 23.3% 7.7% 11.0% -3.1% 216,754 162,343 54,411 33.5% 8,592,138 8,592,138 0.0% PJAM = $500,000 Most Recent Year % Increase (Decrease) Identify items that may indicate a hieghtened RMM: December 31, 2018 December 31, 2017 1 2 Chapter 7: Planning and RMMS 54 60,000,000 shares authorized; 55 25,000,000 shares issued and outstanding 56 Additional paid-in capital 57 Legal reserve 58 Accumulated deficit 59 Accumulated other comprehensive loss 60 Net loss not recognized as pension cost 194,021 65,320 (6,340,449) (1,026,713) (271,498) 194,021 65,320 (7,179,418) (932,027) (220,032) 838,969 (94,686) (51,466) 0.0% 0.0% -11.7% 10.2% 23.4% 133.2% 3.8% 61 Total shareholders' equity 1,212,819 520,002 692,817 62 63 Total liabilities and shareholders' equity $ 11,587,302 $ 11,161,285 $ 426,017 64 65 66 Kid Castle Educational Corporation Consolidated Statements of Operation 67 December 31, 2018 December 31, 2017 December 31, 2016 68 Operating revenue: 69 Sales of goods $ 7,905,949 $ 7,671,392 $ 6,774,260 70 Franchise income 2,380,930 2,205,668 2,080,551 71 Other operating revenue 2,558,232 1,359,552 856,772 3.1% 7.9% 88.2% 12,845,111 11,236,612 9,711,583 14.3% 72 Net operating revenue 73 74 Operating costs: 75 Cost of goods sold 76 Cost of franchising 77 Other operating costs 3,357,441 368,061 1,777,862 3,154,509 451,469 491,869 2,684,650 337,986 616,102 6.4% -18.5% 261.5% 78 Total operating costs 5,503,364 4,097,847 3,638,738 34.3% PJAM = $500,000 1 2 Chapter 7: Planning and RMMS Most Recent Year % Increase (Decrease) Identify items that may indicate a hieghtened RMM: December 31, 2018 December 31, 2017 79 Gross profit 80 Advertising costs 81 Other operating expenses 7,341,747 22,735 6,272,753 7,138,765 29,241 5,342,216 6,072,845 21,833 5,526,318 2.8% -22.2% 17.4% 82 Profit from operations 83 Interest expense 84 Share of profit (loss) of investments 85 Other nonoperating income (loss) net 86 Profit before income taxes and minority 87 interest income 88 Income taxes (expense) benefit 1,046,259 (89,761) 5,109 24,789 1,767,308 (90,299) 27,007 552,611 524,694 (179,825) (39,489) (153,803) -40.8% -0.6% -81.1% -95.5% 151,577 986,396 (106,215) 2,256,627 (278,191) -56.3% -61.8% (173,325) 89 Income (loss) after income taxes 90 Minority interest income 880,181 (41,212) 1,978,436 (101,287) (21,748) (24,463) -55.5% -59.3% 91 Net income (loss) $ 838,969 $ 1,877,149 $ (46,211) -55.3% 0.034 0.075 (0.002) Identify items that may indicate a hieghtened RMM: 1.11 92 Income (loss) per share - basic and diluted 93 94 Vertical Analysis and Other Ratio Analytical Procedures: 95 Liquity ratios: 96 Current Ratio: CA/CL 97 Quick Ratio: Cash + CE + net Trade Rec/ CL 98 Current Debt to Assets Ratio: CL/TA 99 Receivable ratios: 100 AR Turnover: Credit sales/Ending AR 101 Days sales in AR: 365/AR TO 1.19 0.67 0.62 0.59 0.54 4.58 5.91 61.71 79.71 PJAM = $500,000 1 2 Chapter 7: Planning and RMMS Most Recent Year % Increase (Decrease) Identify items that may indicate a hieghtened RMM: December 31, 2018 December 31, 2017 79 Gross profit 80 Advertising costs 81 Other operating expenses 7,341,747 22,735 6,272,753 7,138,765 29,241 5,342,216 6,072,845 21,833 5,526,318 2.8% -22.2% 17.4% 82 Profit from operations 83 Interest expense 84 Share of profit (loss) of investments 85 Other nonoperating income (loss) net 86 Profit before income taxes and minority 87 interest income 88 Income taxes (expense) benefit 1,046,259 (89,761) 5,109 24,789 1,767,308 (90,299) 27,007 552,611 524,694 (179,825) (39,489) (153,803) -40.8% -0.6% -81.1% -95.5% 151,577 986,396 (106,215) 2,256,627 (278,191) -56.3% -61.8% (173,325) 89 Income (loss) after income taxes 90 Minority interest income 880,181 (41,212) 1,978,436 (101,287) (21,748) (24,463) -55.5% -59.3% 91 Net income (loss) $ 838,969 $ 1,877,149 $ (46,211) -55.3% 0.034 0.075 (0.002) Identify items that may indicate a hieghtened RMM: 1.11 92 Income (loss) per share - basic and diluted 93 94 Vertical Analysis and Other Ratio Analytical Procedures: 95 Liquity ratios: 96 Current Ratio: CA/CL 97 Quick Ratio: Cash + CE + net Trade Rec/ CL 98 Current Debt to Assets Ratio: CL/TA 99 Receivable ratios: 100 AR Turnover: Credit sales/Ending AR 101 Days sales in AR: 365/AR TO 1.19 0.67 0.62 0.59 0.54 4.58 5.91 61.71 79.71 PJAM = $500,000 Most Recent Year % Increase (Decrease) Identify items that may indicate a hieghtened RMM: December 31, 2018 December 31, 2017 1.74 210.16 1.57 232.43 0.07 0.69 0.17 3.61 1 2 Chapter 7: Planning and RMMs 102 Inventory ratios: 103 Inventory Turnover: COGS/Ending Inventory 104 Days sales in inventory: 365/ Inv TO 105 Profitability measures: 106 Net profit margin: Ni/Sales, net 107 ROE: NI/SE 108 Financial leverage ratios: 109 Debt to equity: TL/SE 110 Liab to assets: TL/TA 111 Capital Turnover ratios: 112 Asset liquidity: CA/TA 113 Sales to Assets: Sales, net/TA 114 Net worth to sales: SE/Sales, net 115 Other ratios: 116 Cost of Goods Sold % of Sales of goods 117 Cost of Goods Sold %-all 118 Gross Profit % of Sales of goods 119 Gross Profit % of Sales - all 8.38 0.88 20.15 0.94 0.65 0.64 1.11 0.09 1.01 0.05 0.41 0.42 0.43 0.58 0.36 0.59 0.64 0.40 0.37 0.60 0.63 0.57 1 PJAM = $500,000 Most Recent Year 2 Chapter 7: Planning and RMMs December 31, 2018 December 31, 2017 % Increase (Decrease) Identify items that may indicate a hieghtened RMM: 3 Auditor's Expectations (Step 3): Per inquiry with management and other sources of information gathered, there have not been any signficant changes in the business, therefore we do not 4 expect any significant changes in the balances between 2018 (year currently being audit) and 2017 5 Significant Differences (Step 4): Based on our expectation of no significant differences between 2017 and 2018 any increases or decreases that exceed +/- 10% AND +/- $50,000 of the 6 prior year balance will be considered significant and require follow-up to obtain an explanation from management regarding the difference and 7 cooborating evidence that supports the explanation as reasonable. 8 Instructions ---> Identify at least 3 assets and 3 liabilities with heightened RMM; also identify at least 2 income statement balances and 2 ratios (in bottom sections) that may 9 also cause the auditor to assess a heightened RMM: 10 11 Kid Castle Educational Corporation Consolidated Balance Sheets Horizontal (Trend) Analytical Procedure: Dollar Change in Balance and Percentage Change $ Increase (Decrease) % Increase (Decrease) 12 December 31, 2018 December 31, 2017 from Prior Year from Prior Year Identify items that may indicate a hieghtened RMM: 13 ASSETS 14 Current assets 15 Cash and bank balances $ 1,985,818 $ 1,238,212 $ 747,606 60.4% 1. significant increase 16 Bank fixed deposits (pledged) 2,847 363,562 (360,715) -99.2% 17 Notes and accounts receivable, net 2,171,768 2,453,868 (282,100) -11.5% 18 Inventories, net 1,933,153 2,008,739 (75,586) -3.8% 19 Other receivables 396,003 88,139 307,864 349.3% 20 Prepayments and other current assets 475,617 542,794 (67,177) -12.4% 21 Pledged notes receivable 416,238 557,983 (141,745) -25.4% 22 Deferred income tax assets 45,617 42,335 3,282 7.8% 23 Total current assets 7,427,061 7,295,632 131,429 1.8% 24 Deferred income tax assets 49,528 50,481 (953) -1.9% 25 Interest in associates 68,336 58,625 9,711 16.6% 26 Property and equipment, net 2,775,663 2,312,065 463,598 20.1% 27 Intangible assets, net 371,056 572,005 (200,949) -35.1% 28 Long-term notes receivable 356.901 420.636 (63.735) -15.2% PJAM = $500,000 December 31, 2018 December 31, 2017 356,901 420,636 (63,735) 283,469 183,453 100,016 255,288 268,388 (13,100) $ 11,587,302 $ 11,161,285 $ 426,017 Most Recent Year % Increase (Decrease) Identify items that may indicate a hieghtened RMM: -15.2% 54.5% -4.9% 3.8% All bank borrowings -38.4% $ 1 2 Chapter 7: Planning and RMMS 28 Long-term notes receivable 29 Pledged notes receivable 30 Other assets 31 Total assets 32 33 LIABILITIES AND SHAREHOLDERS' EQUITY 34 Current liabilities 35 Bank borrowings, current 36 Notes and accounts payable 37 Accrued expenses 38 Other payables 39 Deposits received 40 Receipts in advance 41 Income tax payable 42 Total current liabilities 43 Bank borrowings, noncurrent 44 Receipts in advance 45 Deposits received 46 Deferred liability 47 Accrued pension liabilities 48 Total liabilities 49 50 Minority interest 51 52 Shareholders' equity 53 Common stock, no par 54 60,000,000 shares authorized; 242,879 $ 1,017,552 1,617,717 270,458 751,151 2,305,980 39,115 6,244,852 1,583,968 1,001,801 839,295 41,775 446,038 10,157,729 1,212,534 $ 389,639 985,764 573,237 912,535 2,372,403 124,418 6,570,530 1,752,776 1,034,260 680,694 38,787 401,893 10,478,940 (969,655) 627,913 631,953 (302,779) (161,384) (66,423) (85,303) (325,678) (168,808) (32,459) 158,601 2,988 44,145 (321,211) -80.0% 161.2% 64.1% -52.8% -17.7% -2.8% -68.6% -5.0% -9.6% -3.1% 23.3% 7.7% 11.0% -3.1% 216,754 162,343 54,411 33.5% 8,592,138 8,592,138 0.0% PJAM = $500,000 Most Recent Year % Increase (Decrease) Identify items that may indicate a hieghtened RMM: December 31, 2018 December 31, 2017 1 2 Chapter 7: Planning and RMMS 54 60,000,000 shares authorized; 55 25,000,000 shares issued and outstanding 56 Additional paid-in capital 57 Legal reserve 58 Accumulated deficit 59 Accumulated other comprehensive loss 60 Net loss not recognized as pension cost 194,021 65,320 (6,340,449) (1,026,713) (271,498) 194,021 65,320 (7,179,418) (932,027) (220,032) 838,969 (94,686) (51,466) 0.0% 0.0% -11.7% 10.2% 23.4% 133.2% 3.8% 61 Total shareholders' equity 1,212,819 520,002 692,817 62 63 Total liabilities and shareholders' equity $ 11,587,302 $ 11,161,285 $ 426,017 64 65 66 Kid Castle Educational Corporation Consolidated Statements of Operation 67 December 31, 2018 December 31, 2017 December 31, 2016 68 Operating revenue: 69 Sales of goods $ 7,905,949 $ 7,671,392 $ 6,774,260 70 Franchise income 2,380,930 2,205,668 2,080,551 71 Other operating revenue 2,558,232 1,359,552 856,772 3.1% 7.9% 88.2% 12,845,111 11,236,612 9,711,583 14.3% 72 Net operating revenue 73 74 Operating costs: 75 Cost of goods sold 76 Cost of franchising 77 Other operating costs 3,357,441 368,061 1,777,862 3,154,509 451,469 491,869 2,684,650 337,986 616,102 6.4% -18.5% 261.5% 78 Total operating costs 5,503,364 4,097,847 3,638,738 34.3% PJAM = $500,000 1 2 Chapter 7: Planning and RMMS Most Recent Year % Increase (Decrease) Identify items that may indicate a hieghtened RMM: December 31, 2018 December 31, 2017 79 Gross profit 80 Advertising costs 81 Other operating expenses 7,341,747 22,735 6,272,753 7,138,765 29,241 5,342,216 6,072,845 21,833 5,526,318 2.8% -22.2% 17.4% 82 Profit from operations 83 Interest expense 84 Share of profit (loss) of investments 85 Other nonoperating income (loss) net 86 Profit before income taxes and minority 87 interest income 88 Income taxes (expense) benefit 1,046,259 (89,761) 5,109 24,789 1,767,308 (90,299) 27,007 552,611 524,694 (179,825) (39,489) (153,803) -40.8% -0.6% -81.1% -95.5% 151,577 986,396 (106,215) 2,256,627 (278,191) -56.3% -61.8% (173,325) 89 Income (loss) after income taxes 90 Minority interest income 880,181 (41,212) 1,978,436 (101,287) (21,748) (24,463) -55.5% -59.3% 91 Net income (loss) $ 838,969 $ 1,877,149 $ (46,211) -55.3% 0.034 0.075 (0.002) Identify items that may indicate a hieghtened RMM: 1.11 92 Income (loss) per share - basic and diluted 93 94 Vertical Analysis and Other Ratio Analytical Procedures: 95 Liquity ratios: 96 Current Ratio: CA/CL 97 Quick Ratio: Cash + CE + net Trade Rec/ CL 98 Current Debt to Assets Ratio: CL/TA 99 Receivable ratios: 100 AR Turnover: Credit sales/Ending AR 101 Days sales in AR: 365/AR TO 1.19 0.67 0.62 0.59 0.54 4.58 5.91 61.71 79.71 PJAM = $500,000 1 2 Chapter 7: Planning and RMMS Most Recent Year % Increase (Decrease) Identify items that may indicate a hieghtened RMM: December 31, 2018 December 31, 2017 79 Gross profit 80 Advertising costs 81 Other operating expenses 7,341,747 22,735 6,272,753 7,138,765 29,241 5,342,216 6,072,845 21,833 5,526,318 2.8% -22.2% 17.4% 82 Profit from operations 83 Interest expense 84 Share of profit (loss) of investments 85 Other nonoperating income (loss) net 86 Profit before income taxes and minority 87 interest income 88 Income taxes (expense) benefit 1,046,259 (89,761) 5,109 24,789 1,767,308 (90,299) 27,007 552,611 524,694 (179,825) (39,489) (153,803) -40.8% -0.6% -81.1% -95.5% 151,577 986,396 (106,215) 2,256,627 (278,191) -56.3% -61.8% (173,325) 89 Income (loss) after income taxes 90 Minority interest income 880,181 (41,212) 1,978,436 (101,287) (21,748) (24,463) -55.5% -59.3% 91 Net income (loss) $ 838,969 $ 1,877,149 $ (46,211) -55.3% 0.034 0.075 (0.002) Identify items that may indicate a hieghtened RMM: 1.11 92 Income (loss) per share - basic and diluted 93 94 Vertical Analysis and Other Ratio Analytical Procedures: 95 Liquity ratios: 96 Current Ratio: CA/CL 97 Quick Ratio: Cash + CE + net Trade Rec/ CL 98 Current Debt to Assets Ratio: CL/TA 99 Receivable ratios: 100 AR Turnover: Credit sales/Ending AR 101 Days sales in AR: 365/AR TO 1.19 0.67 0.62 0.59 0.54 4.58 5.91 61.71 79.71 PJAM = $500,000 Most Recent Year % Increase (Decrease) Identify items that may indicate a hieghtened RMM: December 31, 2018 December 31, 2017 1.74 210.16 1.57 232.43 0.07 0.69 0.17 3.61 1 2 Chapter 7: Planning and RMMs 102 Inventory ratios: 103 Inventory Turnover: COGS/Ending Inventory 104 Days sales in inventory: 365/ Inv TO 105 Profitability measures: 106 Net profit margin: Ni/Sales, net 107 ROE: NI/SE 108 Financial leverage ratios: 109 Debt to equity: TL/SE 110 Liab to assets: TL/TA 111 Capital Turnover ratios: 112 Asset liquidity: CA/TA 113 Sales to Assets: Sales, net/TA 114 Net worth to sales: SE/Sales, net 115 Other ratios: 116 Cost of Goods Sold % of Sales of goods 117 Cost of Goods Sold %-all 118 Gross Profit % of Sales of goods 119 Gross Profit % of Sales - all 8.38 0.88 20.15 0.94 0.65 0.64 1.11 0.09 1.01 0.05 0.41 0.42 0.43 0.58 0.36 0.59 0.64 0.40 0.37 0.60 0.63 0.57
Step by Step Solution
There are 3 Steps involved in it

Get step-by-step solutions from verified subject matter experts