

Question: Please list decision variables, objective function, constraints, and show excel solver Sunchem, a manufacturer of printing inks, has five manufacturing plants worldwide. Their locations and
Please list decision variables, objective function, constraints, and show excel solver
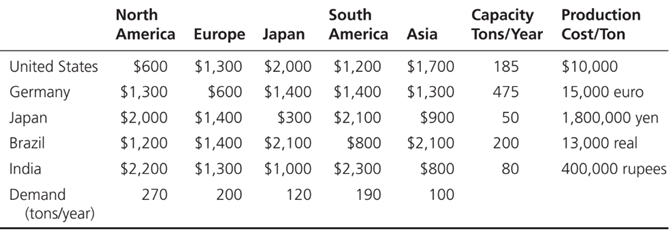
Sunchem, a manufacturer of printing inks, has five manufacturing plants worldwide. Their locations and capacities are shown in Table 1 along with the cost of producing 1 ton of ink at each facility. The production costs are in the local currency of the country where the plant is located. The major markets for the inks are North America, South America, Europe, Japan, and the rest of Asia. Demand at each market is shown in Table 1. Transportation costs from each plant to each market in U.S. dollars are shown in Table 1. Management must come up with a production plan with the goal of minimizing total costs while satisfying all demands for the next year.
If exchange rates are expected as in Table 2, and no plant can run below 50 percent of capacity, how much should each plant produce, and which markets should each plant supply?
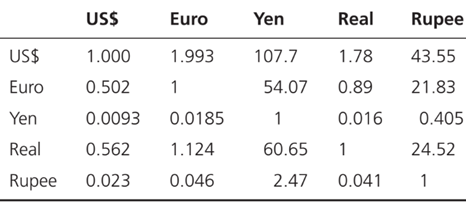
\begin{tabular}{lllclc} & US\$ & Euro & Yen & Real & Rupee \\ \hline US\$ & 1.000 & 1.993 & 107.7 & 1.78 & 43.55 \\ Euro & 0.502 & 1 & 54.07 & 0.89 & 21.83 \\ Yen & 0.0093 & 0.0185 & 1 & 0.016 & 0.405 \\ Real & 0.562 & 1.124 & 60.65 & 1 & 24.52 \\ Rupee & 0.023 & 0.046 & 2.47 & 0.041 & 1 \\ \hline \end{tabular} \begin{tabular}{lrrrrrrl} & NorthAmerica & Europe & Japan & SouthAmerica & Asia & CapacityTons/Year & ProductionCost/Ton \\ \hline United States & $600 & $1,300 & $2,000 & $1,200 & $1,700 & 185 & $10,000 \\ Germany & $1,300 & $600 & $1,400 & $1,400 & $1,300 & 475 & 15,000 euro \\ Japan & $2,000 & $1,400 & $300 & $2,100 & $900 & 50 & 1,800,000 yen \\ Brazil & $1,200 & $1,400 & $2,100 & $800 & $2,100 & 200 & 13,000 real \\ India & $2,200 & $1,300 & $1,000 & $2,300 & $800 & 80 & 400,000 rupees \\ Demand(tons/year) & 270 & 200 & 120 & 190 & 100 & & \\ \hline \end{tabular} \begin{tabular}{lllclc} & US\$ & Euro & Yen & Real & Rupee \\ \hline US\$ & 1.000 & 1.993 & 107.7 & 1.78 & 43.55 \\ Euro & 0.502 & 1 & 54.07 & 0.89 & 21.83 \\ Yen & 0.0093 & 0.0185 & 1 & 0.016 & 0.405 \\ Real & 0.562 & 1.124 & 60.65 & 1 & 24.52 \\ Rupee & 0.023 & 0.046 & 2.47 & 0.041 & 1 \\ \hline \end{tabular} \begin{tabular}{lrrrrrrl} & NorthAmerica & Europe & Japan & SouthAmerica & Asia & CapacityTons/Year & ProductionCost/Ton \\ \hline United States & $600 & $1,300 & $2,000 & $1,200 & $1,700 & 185 & $10,000 \\ Germany & $1,300 & $600 & $1,400 & $1,400 & $1,300 & 475 & 15,000 euro \\ Japan & $2,000 & $1,400 & $300 & $2,100 & $900 & 50 & 1,800,000 yen \\ Brazil & $1,200 & $1,400 & $2,100 & $800 & $2,100 & 200 & 13,000 real \\ India & $2,200 & $1,300 & $1,000 & $2,300 & $800 & 80 & 400,000 rupees \\ Demand(tons/year) & 270 & 200 & 120 & 190 & 100 & & \\ \hline \end{tabular}
Step by Step Solution
There are 3 Steps involved in it

Get step-by-step solutions from verified subject matter experts