

Question: Please list instructions along with Excel functions. Experimental Design and Analysis of Variance (ANOVA) Exercise: Single Factor. A start-up cell phone applications company is interested
Please list instructions along with Excel functions.
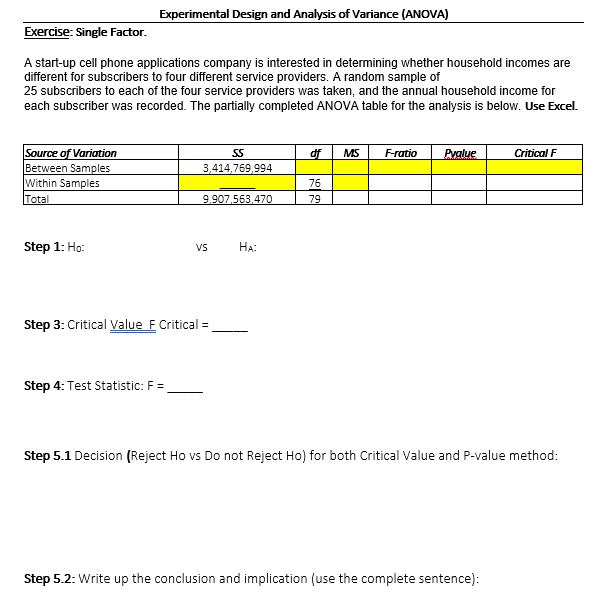
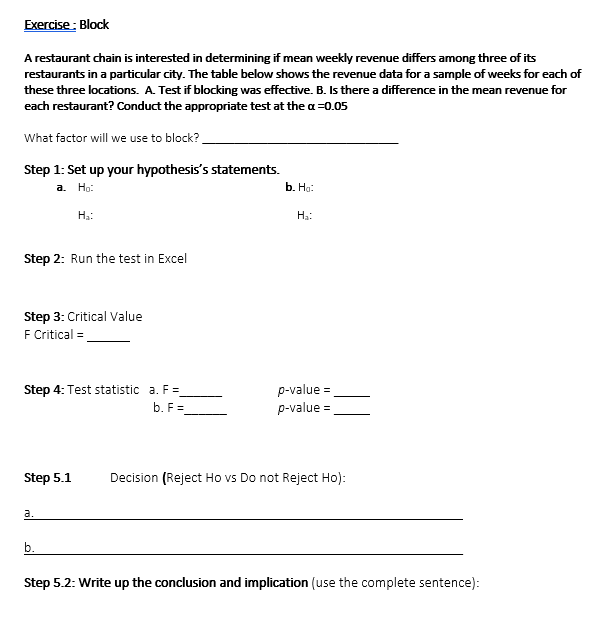
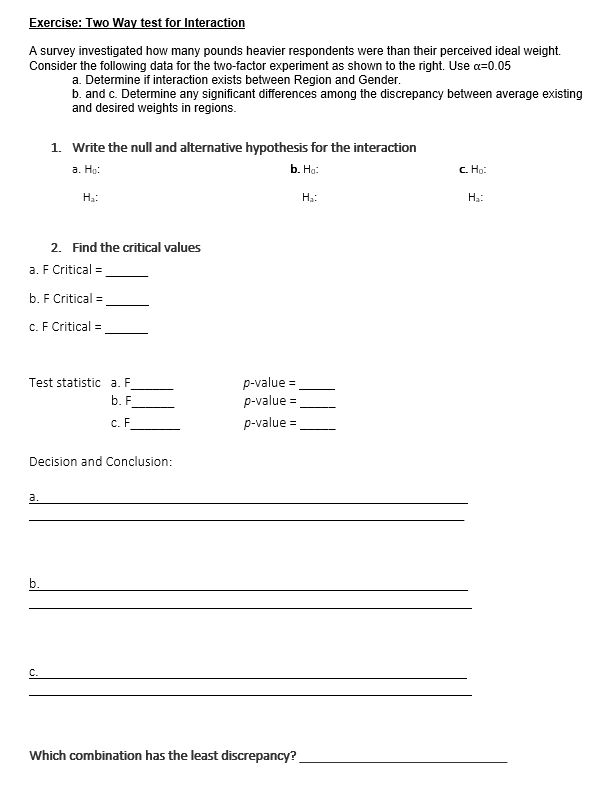
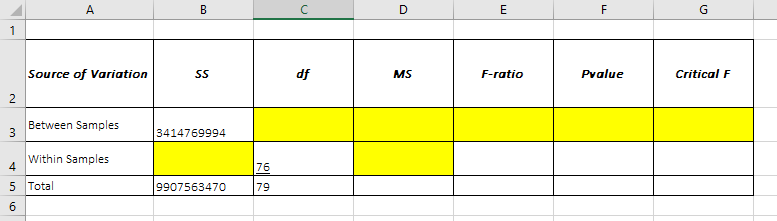
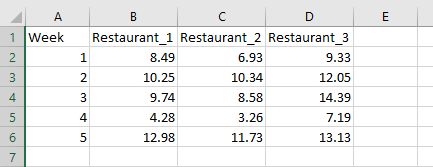
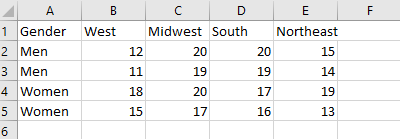
Experimental Design and Analysis of Variance (ANOVA) Exercise: Single Factor. A start-up cell phone applications company is interested in determining whether household incomes are different for subscribers to four different service providers. A random sample of 25 subscribers to each of the four service providers was taken, and the annual household income for each subscriber was recorded. The partially completed ANOVA table for the analysis is below. Use Excel. Source of Variation 55 MS F-ratio Pvalue Critical F Between Samples 3,414,769,994 Within Samples Total 9.907.563,470 79 Step 1: Ho: VS HA: Step 3: Critical Value F Critical = Step 4: Test Statistic: F = Step 5.1 Decision (Reject Ho vs Do not Reject Ho) for both Critical Value and P-value method: Step 5.2: Write up the conclusion and implication (use the complete sentence):Exercise : Block A restaurant chain is interested in determining if mean weekly revenue differs among three of its restaurants in a particular city. The table below shows the revenue data for a sample of weeks for each of these three locations. A. Test if blocking was effective. B. Is there a difference in the mean revenue for each restaurant? Conduct the appropriate test at the a =0.05 What factor will we use to block? Step 1: Set up your hypothesis's statements. Ho: b. Ha: Ha: HA: Step 2: Run the test in Excel Step 3: Critical Value F Critical = Step 4: Test statistic a. F = p-value = b. F = p-value = Step 5.1 Decision (Reject Ho vs Do not Reject Ho): Step 5.2: Write up the conclusion and implication (use the complete sentence):Exercise: Two Way test for Interaction A survey investigated how many pounds heavier respondents were than their perceived ideal weight. Consider the following data for the two-factor experiment as shown to the right. Use a=0.05 a. Determine if interaction exists between Region and Gender. b. and c. Determine any significant differences among the discrepancy between average existing and desired weights in regions. 1. Write the null and alternative hypothesis for the interaction a. Ho: b. Ha: C. Ho: Ha: Ha: Ha: 2. Find the critical values a. F Critical = b. F Critical = C. F Critical = Test statistic a. F p-value = b. F p-value = C. F p-value = Decision and Conclusion: Which combination has the least discrepancy?A B C D E F G Source of Variation df MS F-ratio Pvalue Critical F 2 3 Between Samples 3414769994 4 Within Samples 76 5 Total 9907563470 79 6\f\f
Step by Step Solution
There are 3 Steps involved in it

Get step-by-step solutions from verified subject matter experts